Note: Marketing Factory is renamed to jExperience in version 1.11 and Apache Unomi is renamed to jCustomer. The 1.10 documentation has been updated to reflect the product name change.
You can create optimization tests, also known as AB tests, on content and pages in a web page in Jahia Edit mode. When you AB test a design, you create an optimization test on a page template or a content template. You create the template in Site Settings in jExperience.
Creating an optimization test
When you create an optimization test, you specify:
Whether the test applies to a page template or a content template
A default variant and additional variants
How much traffic to allocate to each variant
The test duration
The goal for the optimization test
To create an optimization test:
In Edit mode, navigate to Site Settings>jExperience>Personalizations and optimization tests.
Select Create new>Optimization Test.
In the Create new optimization test page, in Optimization test, provide a title and description.
In Configuration, select an object type: Note: For a page or content template to be available, the module containing the template must be deployed in your website through Jahia module management.
Page template
A page template describes how content displays on a page. Every page in Jahia has a page template. Choose Page template to AB test a page template against other pages.
Content templates
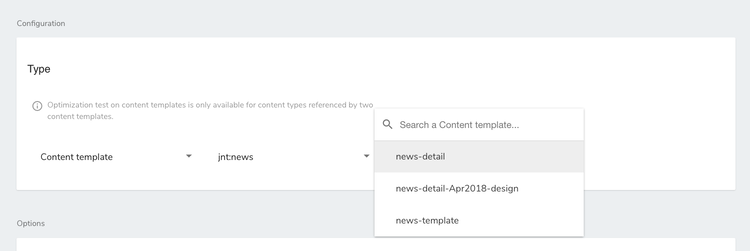
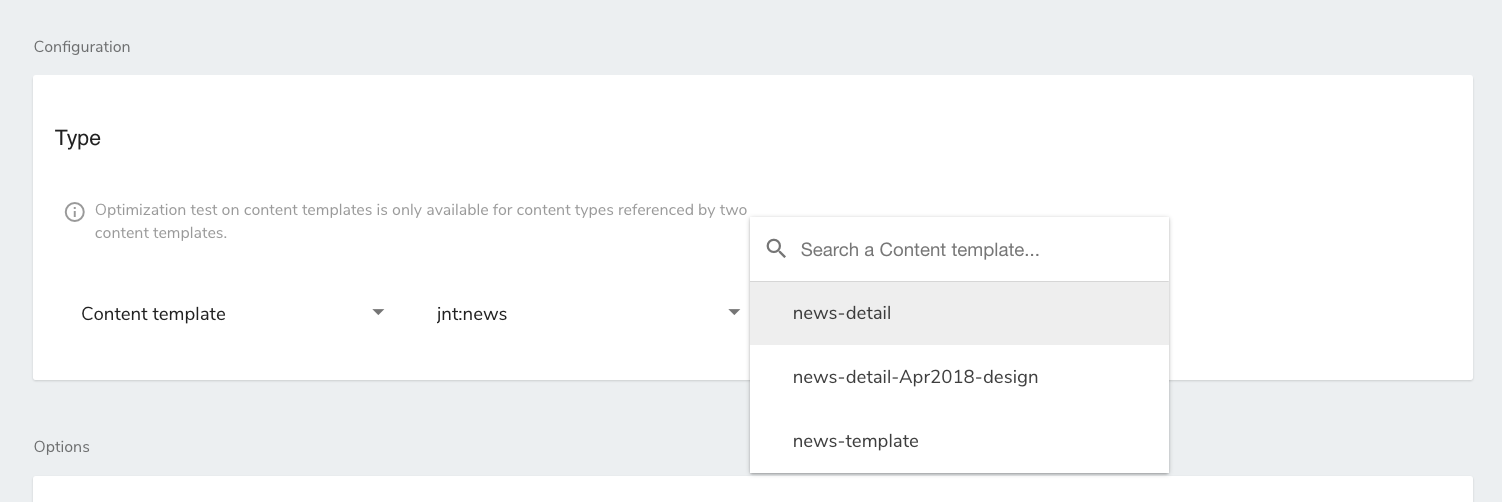
A content template is used for content that displays as a full page. Typically, content templates are used for articles or products. Choose Content templates to compare the performance of two content templates. Note: A content type must be referenced by at least two content templates associated. Otherwise, the content type is not available for AB testing.
Next, select the object that you will AB test. The object will become your default variant and cannot be deleted from the test.
For a page template, select a page template.
For a content template, first select a content type, for example, news, and then select the content template associated with the content type, as shown in the following example.
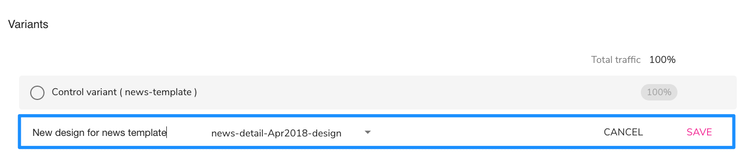
Next, you must select one or more additional variants and define a control variant. To add a variant:
Click Add variant.
In Variant name, type a name.
In Select template, choose a template from the list.
Click Save.
Add additional variants as needed.
To define the control variant, select the check box beside a variant.
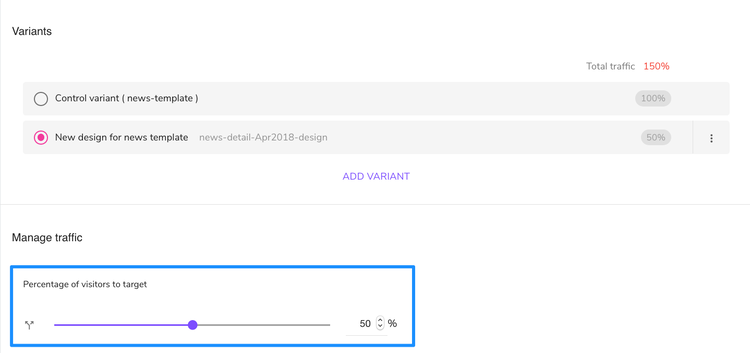
To specify the amount of traffic that is directed to the content or page template:
Select a variant.
In Manage traffic, use the slider to change the percentage of traffic to allocate to this variant. You can also enter a numeric value in the percentage field.
Ensure that the total traffic allocation of the variants is 100%.
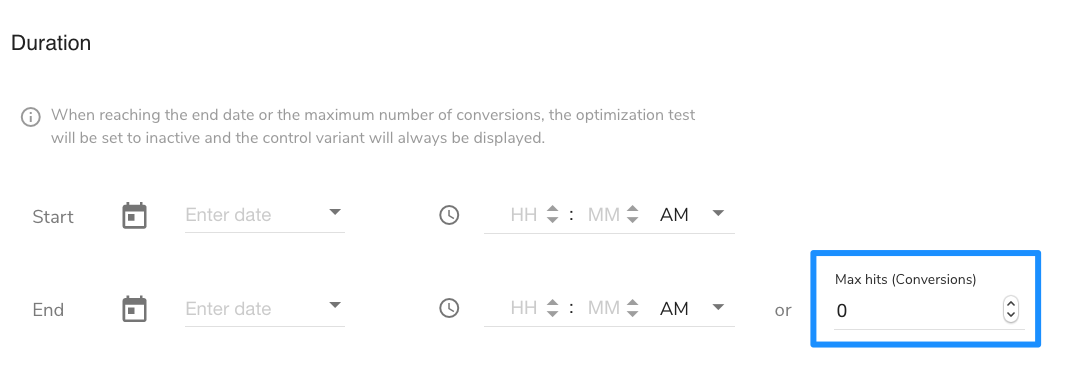
To limit the duration of the test, do one of the following: Note: By default, an optimization test starts running when you save it.
Choose a start and end date for the test.
Set a maximum number of hits for the test. When the goal of the optimization test has been converted more times than the maximum number of hits, the test stops. To disable the maximum number of hits, set the value to 0.
To compare the performance across your variations, you must setup a goal. The only goal type available is page visit.
Set the goal type to page visit.
Select the page that you want to use as your goal page.
Viewing optimization test reports
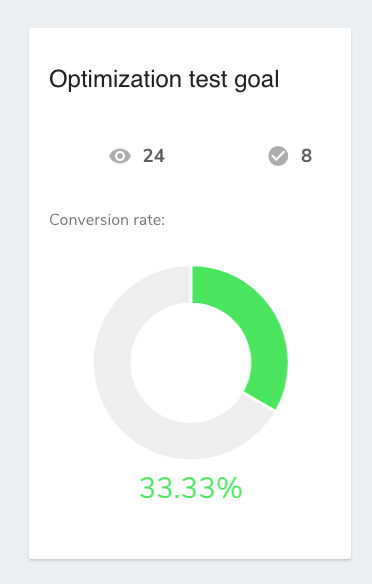
You can view reporting information for optimization test that are running. The report page displays the Optimization test goal chart at the left of the page, the Variant - quantitative chart at the right of the page, and Goal info at the bottom of the page.
The Optimization test goal report displays the total views and conversion rates for all variants in your optimization test. In the report, the numbers at the top of the chart indicate the total number of views for all variants and the total number of conversion variants. In the example, the variant has been viewed 24 times and has had 8 conversions. The report also displays conversion rate of visitors in chart and numeric format.
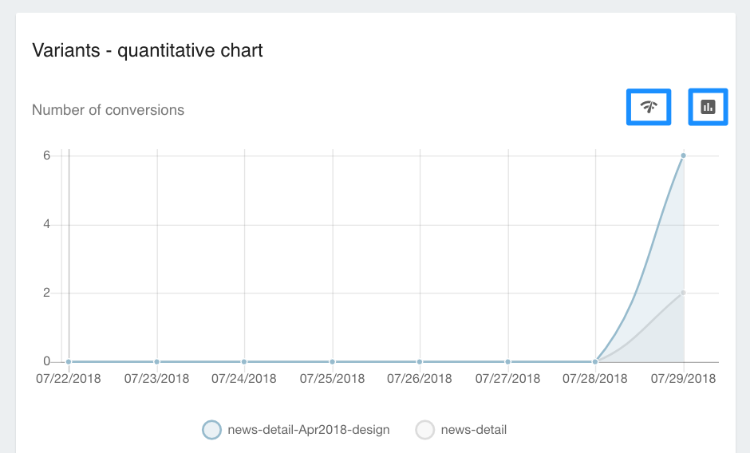
The Variant - quantitative chart at the right shows the number of conversion by date. You can change what displays in the chart by modifying the chart's date and other settings. Data also displays below the chart in a table.
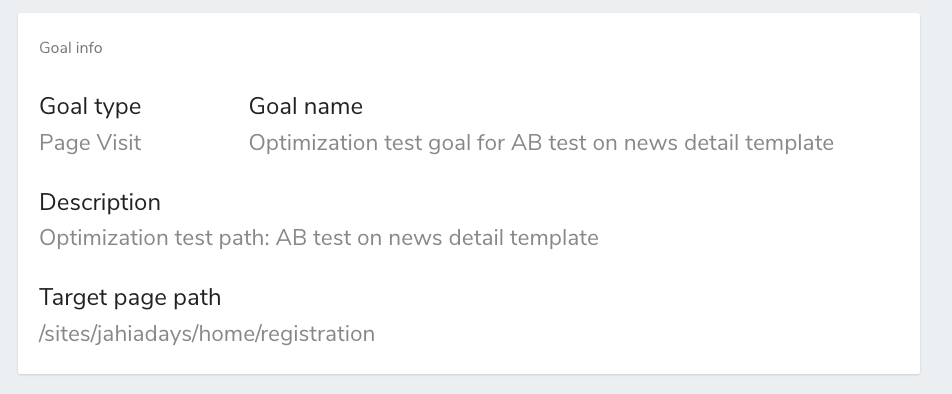
The Goal info section displays the goal type, name, and description and the path to the target page for the test.
Changing the chart display date
You can use the date picker at the top of the Variant - quantitative chart to change the date range for data that displays in the chart and datatable. You can can select a date range, such as 3 month, or select Custom to specify a custom date range.
Changing the chart display type
You can change the information that displays in the Variant - quantitative chart in the following ways:
To show the total number of conversions by date, select Change to performance chart . To show the conversions rate by date, select Change to quantitative chart .
To view data as a line chart, select Change to line chart . To view data as a bar chart, select Change to bar chart.
To show or hide a variant on the chart, click on a variant name below the chart. For example, hide a variant to focus on other variants in the report.
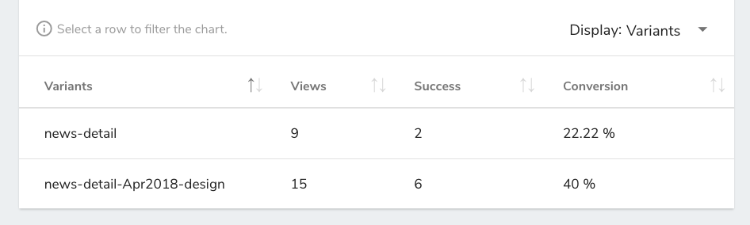
Viewing optimization test data in a table
You can view optimization test data in the table below the chart. By default, the table contains the following columns:
Number of times the variant was viewed
Number of conversions after the variant was viewed by a site visitor
The conversion rate of the variant as a percentage
You can sort data in columns in ascending or descending data by clicking the arrow button at the top of a column.
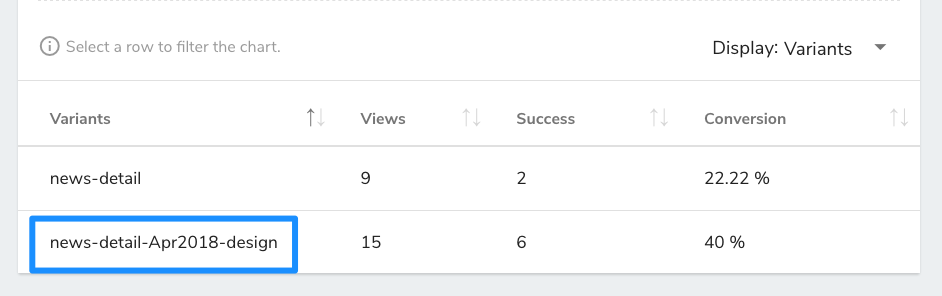
Filtering the chart
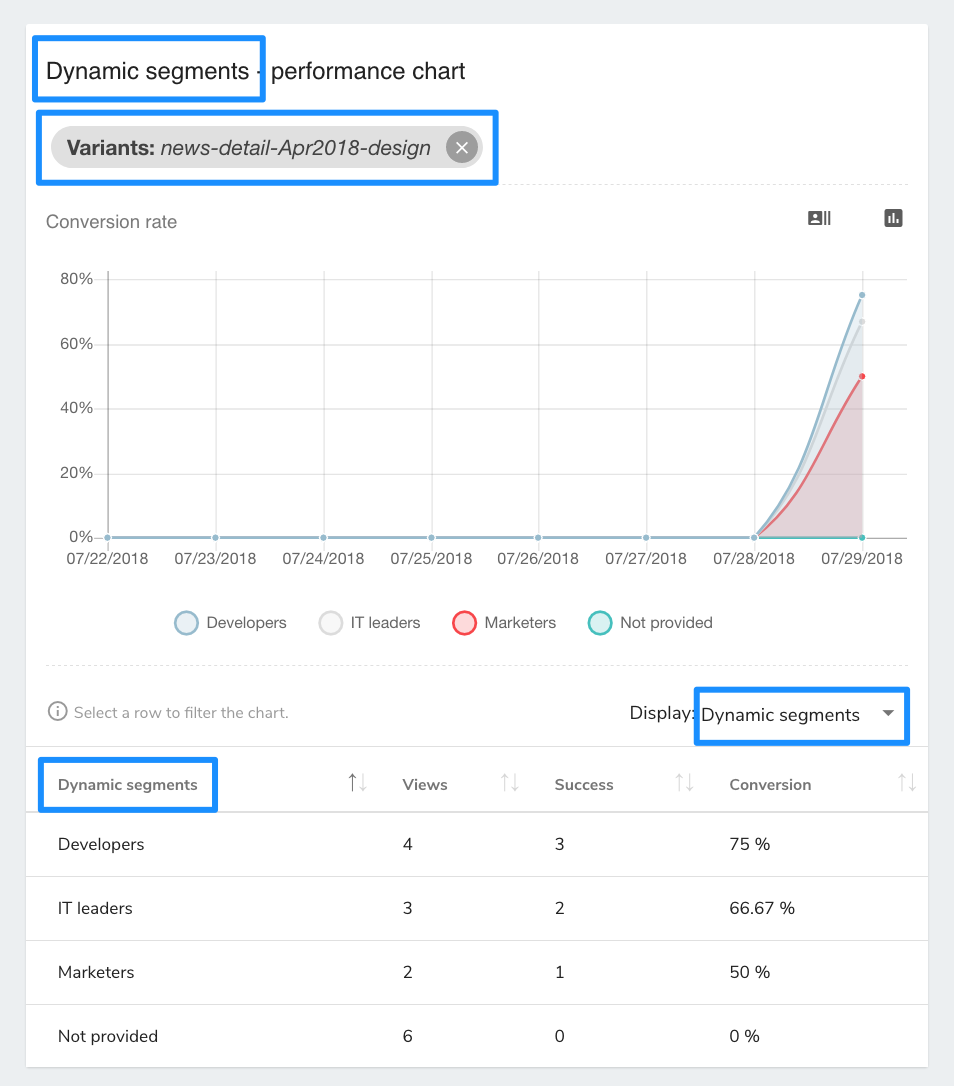
In the table, you can select a variant to display more information about the variant in the chart and table. For example, to focus on the performance of a specific variant select the variant.
The chart and table then displays new information. The chart now displays the conversion rate details by segment for the selected variant.