Managing memory and performing thread dumps
Memory

This panel provides information about allocated memory, used memory and free memory.
It is possible to run the garbage collector to flush the memory in use (warning: the consequences of a forced memory flush on a production site can severely alter performance and only administrators with a thorough knowledge of application servers and JVM operation should use this option)
Thread Dump
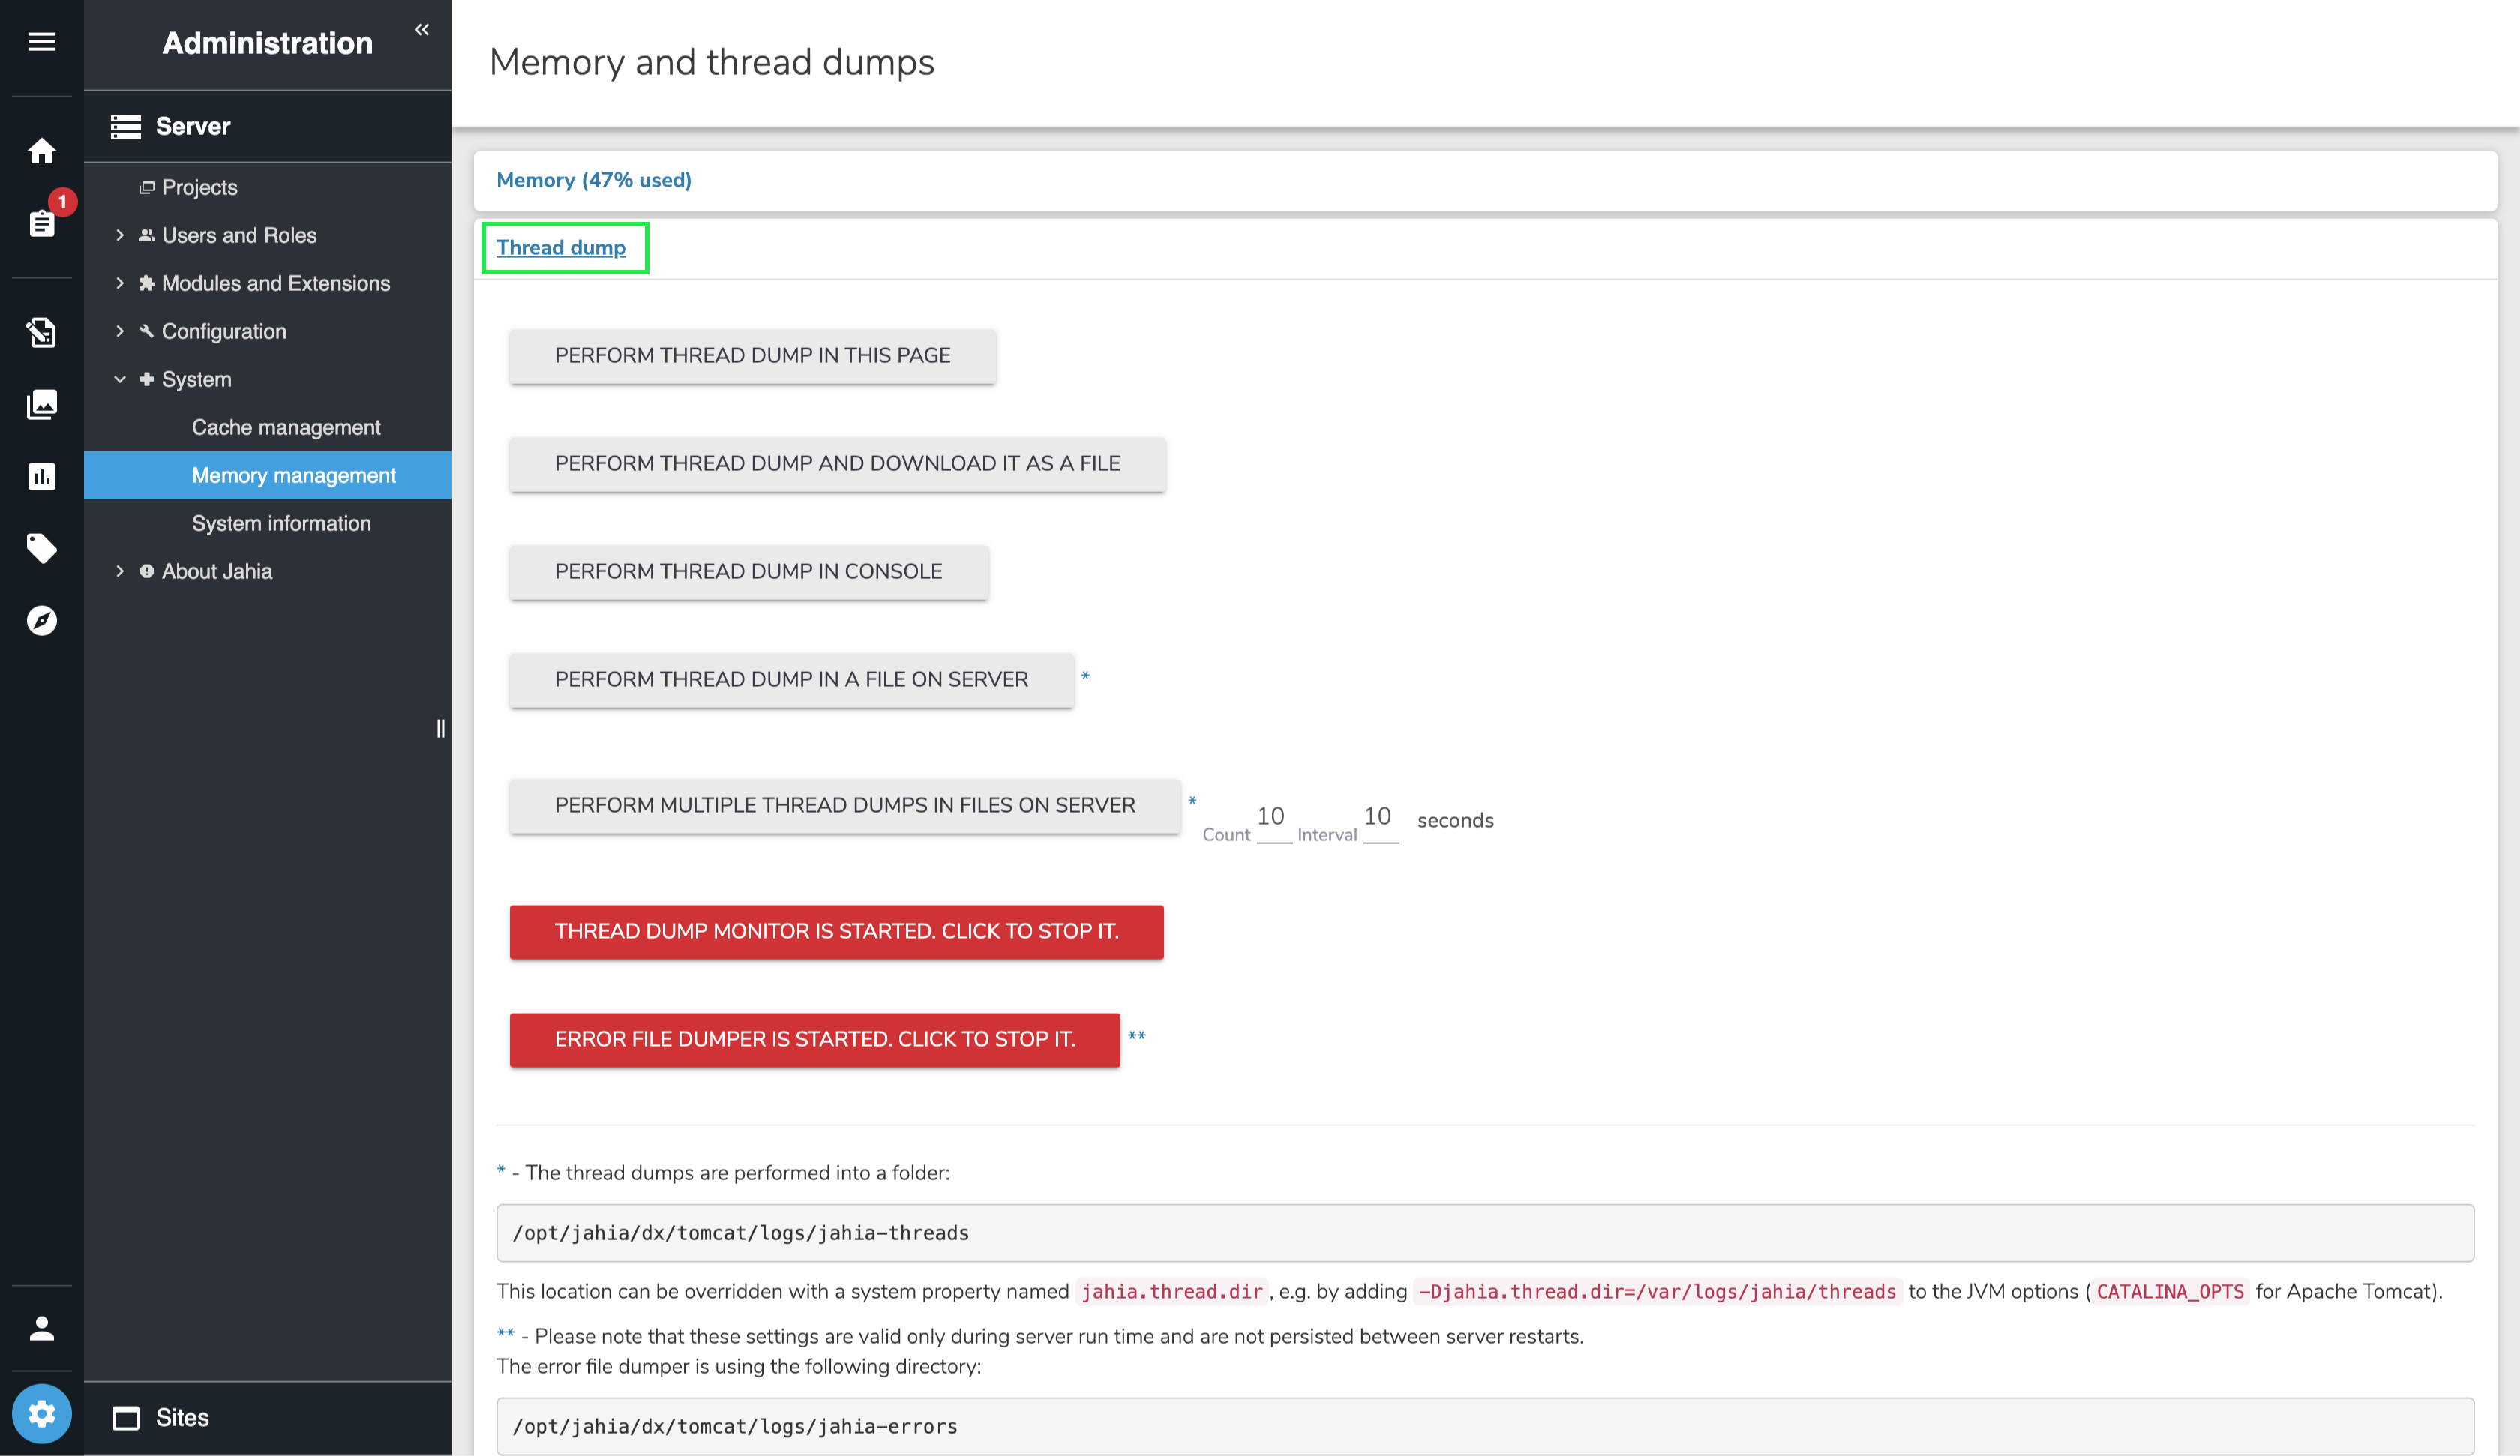
Click the "Thread dump" link to display the options.
This panel offers various options to run a thread dump and get the results
- In a new window of the browser
- In a downloadable file - In the Java console
- In a file automatically stored on disk [Jahia install directory]/temp/Jahia-threads
- Perform a thread dump to analyze the currently running threads. A Thread Dump Analyzer is also available in this sub-section.
- Several dumps at a regular interval stored on disk
It is possible to stop Thread Dump Monitor and Error File Dumper. Those two features run in the background and dump as much information as possible when an error occurs. While very useful for support, those options should be deactivated on platforms submitted to heavy load, as those features themselves are resource-intensive when they are called. If your platform encounters errors due to overload, those options will make things worse by adding load to the load.
The last line of that section refers to the launch of a thread analyzer tool.