Troubleshooting & Debugging
Common issues & solutions
In this section, we will list some common issues you may encounter.
React JSX & (X)HTML are not 100% the same
The JSX syntax for HTML is different from the HTML syntax. In the table below, we highlight the most important differences. Tools also exist to transform from one syntax to another such as transform.tools/html-to-jsx
| Feature | HTML Syntax | JSX Syntax |
| Attributes | HTML attributes are written using the attribute="value" syntax, e.g., class="example". |
JSX attributes are written using camelCase syntax, e.g., className="example". |
| Self-Closing Tags | Self-closing tags are written with a slash (/) before the closing angle bracket, e.g., <img src="example.jpg" />. |
Self-closing tags are written similarly to HTML, e.g., <img src="example.jpg" />. |
| Inline Styles | Inline styles are declared using the style attribute with CSS syntax, e.g., <div style="color: red;"></div>. |
Inline styles are declared using JavaScript objects within curly braces, e.g., <div style={{ color: 'red' }}></div>. |
| Class and Style Attributes | Class and style attributes are written using the class and style attributes, e.g., <div class="example" style="color: red;"></div>. |
Class and style attributes are written using camelCase syntax, e.g., <div className="example" style={{ color: 'red' }}></div>. |
| Comments | HTML-style comments are written using <!-- -->, e.g., <!-- This is a comment -->. |
JavaScript-style comments (// or /* */) can be used within curly braces, e.g., {/* This is a comment */}. |
| Dynamic Content Insertion | Dynamic content is inserted using template languages or server-side rendering. | Dynamic content is inserted using JavaScript expressions within curly braces, e.g., { variable }. |
| Conditional Rendering | Conditional rendering is achieved using template languages or server-side rendering. | Conditional rendering is achieved using JavaScript ternary operators within curly braces, e.g., { condition ? <Component /> : null }. |
| Event Handling | Event handlers are declared using attributes like onclick, e.g., <button onclick="handleClick()">Click Me</button>. |
Event handlers are declared using camelCase syntax and JSX attributes, e.g., <button onClick={handleClick}>Click Me</button>. |
Error during deployment
If you get an error such as this after a yarn deploy command:
Apr  3 09:27:53 ip-10-0-3-208 docker_jahia[10891]: 2024-04-03 09:27:53,538: ERROR [GraalVMEngine] - Error enabling bundle solid-template
Apr  3 09:27:53 ip-10-0-3-208 docker_jahia[10891]: java.io.IOException: Cannot get resource solid-template / dist/main.js
Apr  3 09:27:53 ip-10-0-3-208 docker_jahia[10891]: #011at org.jahia.modules.npm.modules.engine.jsengine.GraalVMEngine.getGraalSource(GraalVMEngine.java:153) ~[?:?]
Apr  3 09:27:53 ip-10-0-3-208 docker_jahia[10891]: #011at org.jahia.modules.npm.modules.engine.jsengine.GraalVMEngine.enableNpmModule(GraalVMEngine.java:76) ~[?:?]
Apr  3 09:27:53 ip-10-0-3-208 docker_jahia[10891]: #011at org.jahia.modules.npm.modules.engine.NpmModuleListener.bundleChanged(NpmModuleListener.java:91) ~[?:?]
Apr  3 09:27:53 ip-10-0-3-208 docker_jahia[10891]: #011... suppressed 5 lines
This might be because the yarn deploy command requires the project to have been built at least once, which you can do with the yarn build command. The yarn watch command will execute both the build and deploy commands, so this is what is used in this tutorial. You might also want to check if any errors have occurred during the build process.
How to debug server-side JavaScript code
GraalVM supports the debugging of guest language applications and provides a built-in implementation of the Chrome DevTools Protocol. This allows you to attach compatible debuggers such as Chrome Developer Tools to GraalVM.
Debugging your own components can be useful. GraalVM offers such functionality, and we will explain how to activate and use it here.
Setup remote GraalVM debugging using the following GraphQL mutation:
mutation {
  admin {
    jahia {
      configuration(
        pid: "org.jahia.modules.javascript.modules.engine.jsengine.GraalVMEngine"
      ) {
        polyGlotInspect: value(name: "polyglot.inspect", value: "0.0.0.0:9229")
        polyGlotInspectSuspend: value(name: "polyglot.inspect.Suspend", value:"false")
        polyGlotInspectSecure: value(name: "polyglot.inspect.Secure", value:"false")
      }
    }
  }
}
You can simply copy and paste this GraphQL mutation request by navigating to Developer Tools -> GraphQL in Jahia:

You will then see an output in the docker container logs (not in Jahia logs) that looks like this:
Debugger listening on ws://0.0.0.0:9229/rh72qHC4lrlkOotX2SAjElIDwRK_6Nwhy3MJIDUNV9A
For help, see: https://www.graalvm.org/tools/chrome-debugger
E.g. in Chrome open: devtools://devtools/bundled/js_app.html?ws=0.0.0.0:9229/rh72qHC4lrlkOotX2SAjElIDwRK_6Nwhy3MJIDUNV9A
You can then use the devtools link in a Chrome browser to debug the server-side JavaScript code!
It will load the fully compiled JavaScript by default. The best thing is to use search to look for the code you want to debug and position a breakpoint where you want.
Let’s look at an example. First, open a new tab and use the URL that was generated in the logs:
![]()
If it loads up that means that it is properly connected. If you get an error make sure the server is accessible at that URL and that the port (and path) match. Also check that the port 9229 is accessible (if you are using Docker it must be mapped).
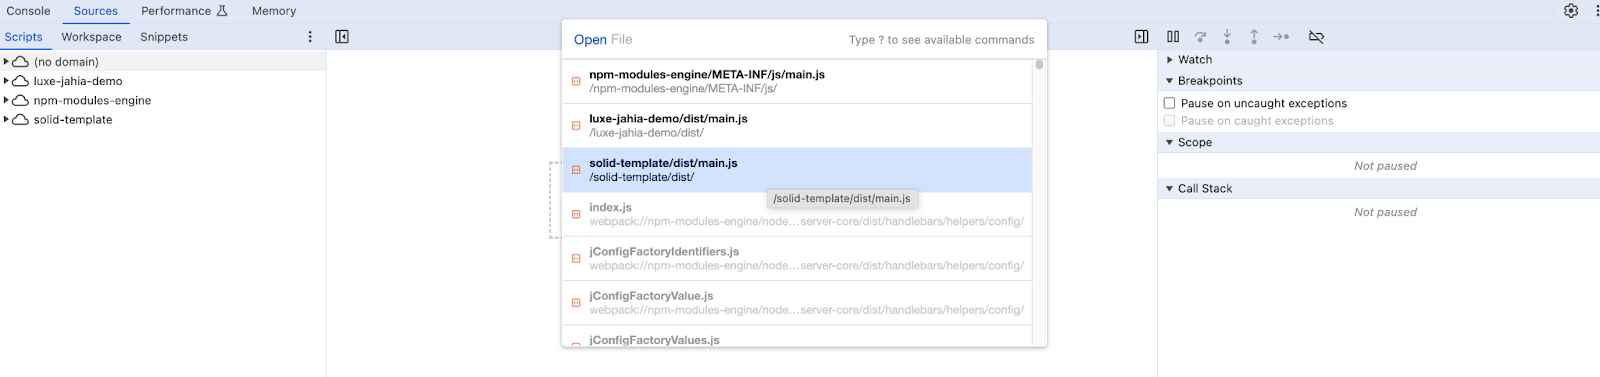
Next, click on the “Sources” tab. You should see the following screen:

Click on the “Open file” link, and in the popup, select the solid-template/dist/main.js file, as illustrated in the screenshot below:
Then you should be able to navigate in the scripts to the PageHome.jsx template and put a breakpoint on the return statement:

Then, switch back to another tab and reload the home page. If all went well you should see that the page has stopped loading and on the debugger tab that it has stopped on the breakpoint. In the screenshot below we have the home page loaded in one window and the debugger in another window below, that is stopped on the breakpoint. Note that the page hasn’t finished loading which is normal since we are stopped on the breakpoint.

You can then click on the blue Play button at the right in the top bar to continue the page's execution. Every time you reload the home page, it stops on the breakpoint, so make sure to remove it if you no longer need it.
From here on, you have the full power of the JavaScript debugger at your disposal to debug server-side JavaScript execution. If you want to learn more about the Chrome devtools, you can visit their official documentation here: https://developer.chrome.com/docs/devtools. You can also find some information on the GraalVM Chrome Debugger page here, although Jahia integrates it a little differently in terms of configuration deployment: https://www.graalvm.org/latest/tools/chrome-debugger/