Monitoring the health of your system
About the Jahia Healthcheck probe
The Healthcheck module provides insights about a platform's health and can help trigger alerts or pay attention to key components that might need close attention. Jahia's Healthcheck module provides a JSON output and it can be triggered at will with minimal impact on the platform load.
The healthcheck module is a core component that can be used in conjunction with extension modules in order to provide more information to the monitoring systems.
The healthcheck module returns a global status for the server, as well a status for all tested components. The status can be:
- GREEN (Nominal status)
- YELLOW (Non critical problem)
- RED (Critical issue)
Usage
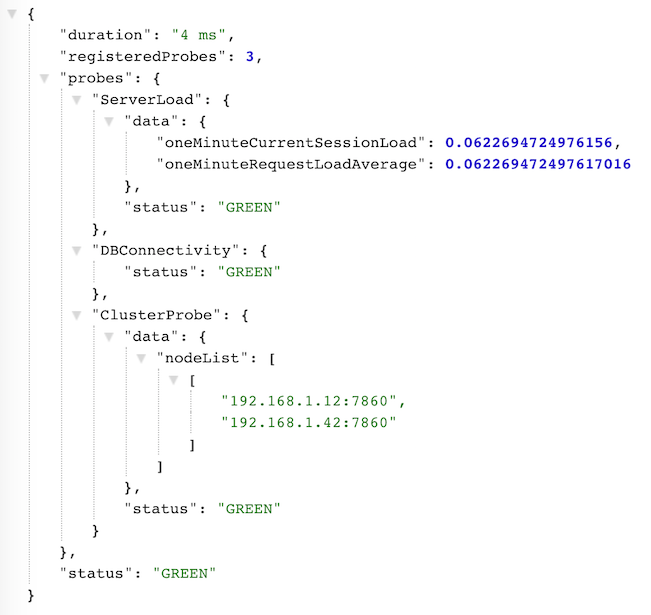
The healthcheck is available through the servlet /healthcheck to all users who are granted the Jahia server role monitoring It returns a JSON object with the following structure:
Extensions
While the core healthcheck provide basic capabilities such as database connectivity and server load checks, additional modules can extend its capabilities. When deploying a proper healthcheck module extension, the healthcheck servlet will automatically be added with the new information.
A typical Healthcheck extension is the healcheck-cluster module.
Custom extensions
Developping a custom extension is straightforward and can be done in two different ways:
Forking the healcheck-extensionexample module (https://github.com/Jahia/healcheck-extensionexample)
Manually declarating an OSGi service and implementing a Java interface (described bellow)
Steps to creating a Healthcheck extension:
Updating the pom.xml file
Add the following elements to the pom file:
<dependencies>
    <dependency>
        <groupId>org.jahia.modules</groupId>
        <artifactId>healthcheck</artifactId>
        <version>[1.0,2.0]</version>
        <scope>provided</scope>
    </dependency>
</dependencies>

<properties>
    <jahia-depends>default</jahia-depends>
    <jahia-module-type>system</jahia-module-type>
    <import-package>org.jahia.modules.healthcheck.interfaces</import-package>
</properties>

<build>
    <plugins>
        <plugin>
            <groupId>org.apache.felix</groupId>
            <artifactId>maven-bundle-plugin</artifactId>
            <extensions>true</extensions>
            <configuration>
                <instructions>
                    <Jahia-Depends>default, healthcheck</Jahia-Depends>
                    <_dsannotations>*</_dsannotations>
                </instructions>
            </configuration>
        </plugin>
    </plugins>
</build>
Creating a new Java class
In the extensionexample module, we decided to create a org.jahia.modules.healthcheckexample.probes package and a ProbeExample.java file.
Creating a Probe OSGi service
In the Java Class previously created, implement the Probe interface (org.jahia.modules.healthcheck.interfaces.Probe) and declare a new Probe service:
import org.osgi.service.component.annotations.Component;
import org.jahia.modules.healthcheck.interfaces.Probe;

@Component(service = Probe.class, immediate = true)
public class ProbeExampleService implements Probe {
   ...
}
Then, implement all 3 methods:
@Override
public String getStatus() {
    ...
    return "GREEN";
}

@Override
public JSONObject getData() {
    // Contains potential error messages. Return null if no message is necessary
    return jsonObject;
}

@Override
public String getName() {
    return "ProbeExample";
}