Building a Feedback Form
The goal of this self-contained guide is to create a feedback form that uses client-side JavaScript to send data to a server. This first half will be about building the form, the second half about collecting the data on the server with jCustomer.
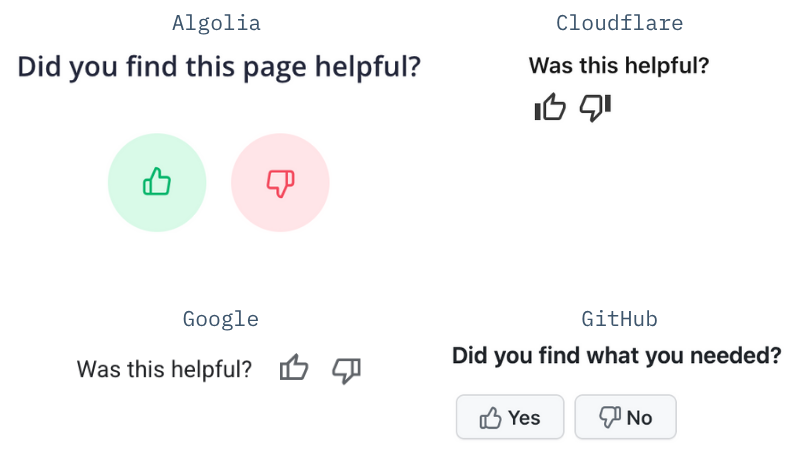
We will build something very similar to the widget that can be found on many documentation websites:
This guide assumes you have followed the Getting Started guide and have a working Jahia instance with a JavaScript Module running on it. If you haven't done so, please follow the instructions in that guide before continuing.
Client-Side JavaScript
The JavaScript Modules Library features a component we haven't used yet: RenderInBrowser. Contrary to the getting started, where all views were rendered on the server, this component allows you to render a component in the browser, and the browser only.
This render mode is useful for components that only make sense in the browser, because they need to be interactive, and are not usable without client-side JavaScript.
Let's start by creating a very basic node type and view for our feedback form:
-
Create
src/components/FeedbackWidget/definition.cndwith the following content (use the right namespace for your module):[hydrogen:feedbackWidget] > jnt:content, hydrogenmix:component - question (string) = 'Was this helpful?'We'll keep this definition simple in this guide, but feel free to make the widget as configurable as desired.
-
Create
src/components/FeedbackWidget/default.server.tsxwith the following content:import { jahiaComponent } from "@jahia/javascript-modules-library"; interface Props { question: string; } jahiaComponent( { nodeType: "hydrogen:feedbackWidget", componentType: "view", }, ({ question }: Props) => <div>{question}</div>, );
Start or restart yarn dev to push the component to your local Jahia instance. Add your component to a page and check that it renders correctly. You should see "Was this helpful?" in the browser.
You can try replacing the div with <button onClick={() => alert("Hello World!")}>Click me</button> to see that the component, when rendered on the server, does not become interactive. This is intended: the default rendering mode (Server-Side Rendering, SSR) ships no JavaScript to the browser.
Let's create an interactive component: create a file named src/components/FeedbackWidget/Widget.client.tsx with the following content:
export default function Widget() {
  return (
    <button
      type="button"
      onClick={() => {
        alert("Hello World!");
      }}
    >
      Click me
    </button>
  );
}
You might have noticed that the file uses the .client.tsx extension: it will be transpiled during the client build step, whereas the .server.tsx files are transpiled during the server build step. These extensions can be changed in the vite.config.js file, but we recommend keeping the default ones for consistency with the rest of the community.
Update the src/components/feedbackWidget/default.server.tsx file to use the new component:
import { jahiaComponent, RenderInBrowser } from "@jahia/javascript-modules-library";
import Widget from "./Widget.client.jsx";

interface Props {
  question: string;
}

jahiaComponent(
  {
    nodeType: "hydrogen:feedbackWidget",
    componentType: "view",
  },
  ({ question }: Props) => <Island clientOnly component={Widget} props={{ question }} />,
);
You'll need to restart yarn dev for Vite to collect your new client files, but once pushed, should see the exact same button as before, but now it will alert "Hello World!" when clicked.
The Island component is a wrapper that will ensure the code of Widget gets forwarded to the browser, enabling what is called Island Architecture: this component will be rendered client-side, but the rest of the page will remain server-rendered. This is a great way to improve performance, as it allows to only ship the JavaScript that is needed for the interactive parts of your page.
The props prop of Island allows you to pass props to the component that will be rendered in the browser. Because they will be sent to the browser, they should be serializable.
If you nest children to Island in clientOnly mode, they will be displayed until Widget is loaded. This is where you can put a loading message for instance: <Island clientOnly component={Widget}>The widget is loading...</Island>.
You now have all the tools needed to build any client-side component, but keep on reading to learn how to send data to jCustomer.
We'll build the simplest feedback form possible: two buttons, one for "yes" and one for "no". Styling is left as an exercise for the reader, we'll keep the default browser styles in this guide.
Update Widget.client.tsx to the following content:
import { useState } from "react";

export default function Widget({ question }: { question: string }) {
  const [sent, setSent] = useState(false);

  const handler = (happy: boolean) => () => {
    // TODO: send `happy` somewhere
    setSent(true);
  };

  // Once clicked, thank the user for their feedback
  if (sent) return <aside>Thank you for your feedback!</aside>;

  return (
    <aside>
      {question}
      <button type="button" onClick={handler(true)}>
        Yes
      </button>
      <button type="button" onClick={handler(false)}>
        No
      </button>
    </aside>
  );
}
What matters now is what we place in handler. For now we only set a state variable to thank the user for their feedback, but that is not enough: we need to send the data to the server.
If you are using Google Tag Manager, you can use the window.dataLayer object to send data to GTM:
// Replace TODO in the handler with this to push to GTM:
dataLayer.push({
  event: "feedback",
  happy,
});
Starting jCustomer Locally
jCustomer is a Jahia technology that allows collecting and processing data from visitors to create personalized experiences, alongside its peer technology jExperience. Put together, they create what is known as a DXP, for Digital Experience Platform.
Running jCustomer locally is a bit tricky. You'll need to update both the docker-compose.yml and the docker/provisioning.yml files to add the jCustomer stack.
docker-compose.yml
-
Give the
jahiaservice a static IP address:services: jahia: # ... networks: default: ipv4_address: 172.16.1.100 -
Add the jCustomer containers:
services: # ... elasticsearch: image: elasticsearch:7.17.28 ports: - 9200:9200 environment: discovery.type: single-node cluster.name: jahia-es-cluster kibana: image: kibana:7.17.28 ports: - 5601:5601 environment: discovery.type: single-node elasticsearch.hosts: http://elasticsearch:9200 jcustomer: image: jahia/jcustomer:2.6 depends_on: - elasticsearch ports: - 9443:9443 - 8181:8181 - 8102:8102 environment: UNOMI_ELASTICSEARCH_ADDRESSES: elasticsearch:9200 UNOMI_ELASTICSEARCH_CLUSTERNAME: jahia-es-cluster UNOMI_CLUSTER_PUBLIC_ADDRESS: http://localhost:8181 UNOMI_CLUSTER_INTERNAL_ADDRESS: https://jcustomer:9443 UNOMI_THIRDPARTY_PROVIDER1_IPADDRESSES: 172.16.1.100 UNOMI_THIRDPARTY_PROVIDER1_ALLOWEDEVENTS: login,updateProperties UNOMI_ROOT_PASSWORD: karaf UNOMI_HAZELCAST_TCPIP_MEMBERS: jcustomer -
Add a network stack at the end of the file:
networks:
  default:
    ipam:
      config:
        - subnet: 172.16.1.0/24
docker/provisioning.yml
Add this at the end of the file:
# Install and start jExperience
- installBundle:
- "mvn:org.jahia.modules/jexperience/3.6.2"
- "mvn:org.jahia.modules/jexperience-dashboards/1.0.0"
autoStart: true
uninstallPreviousVersion: true
# Configure jExperience
- editConfiguration: "org.jahia.modules.jexperience.settings"
configIdentifier: "global"
properties:
jexperience.jCustomerURL: "https://jcustomer:9443"
jexperience.jCustomerUsername: "karaf"
jexperience.jCustomerPassword: "karaf"
jexperience.jCustomerTrustAllCertificates: "true"
jexperience.jCustomerUsePublicAddressesForAdmin: "false"
jexperience.jCustomerKey: "670c26d1cc413346c3b2fd9ce65dab41"
# Configure Kibana dashboards
- editConfiguration: "org.jahia.modules.kibana_dashboards_provider"
properties:
kibana_dashboards_provider.kibanaURL: "http://kibana:5601"
kibana_dashboards_provider.kibanaUser: "elastic"
kibana_dashboards_provider.kibanaPassword: "ELASTIC_PASSWORD"
kibana_dashboards_provider.KibanaProxy.enable: "true"
kibana_dashboards_provider.KibanaProxy.cloud: "true"
- installBundle:
- "mvn:org.jahia.modules/kibana-dashboards-provider/1.4.0"
autoStart: true
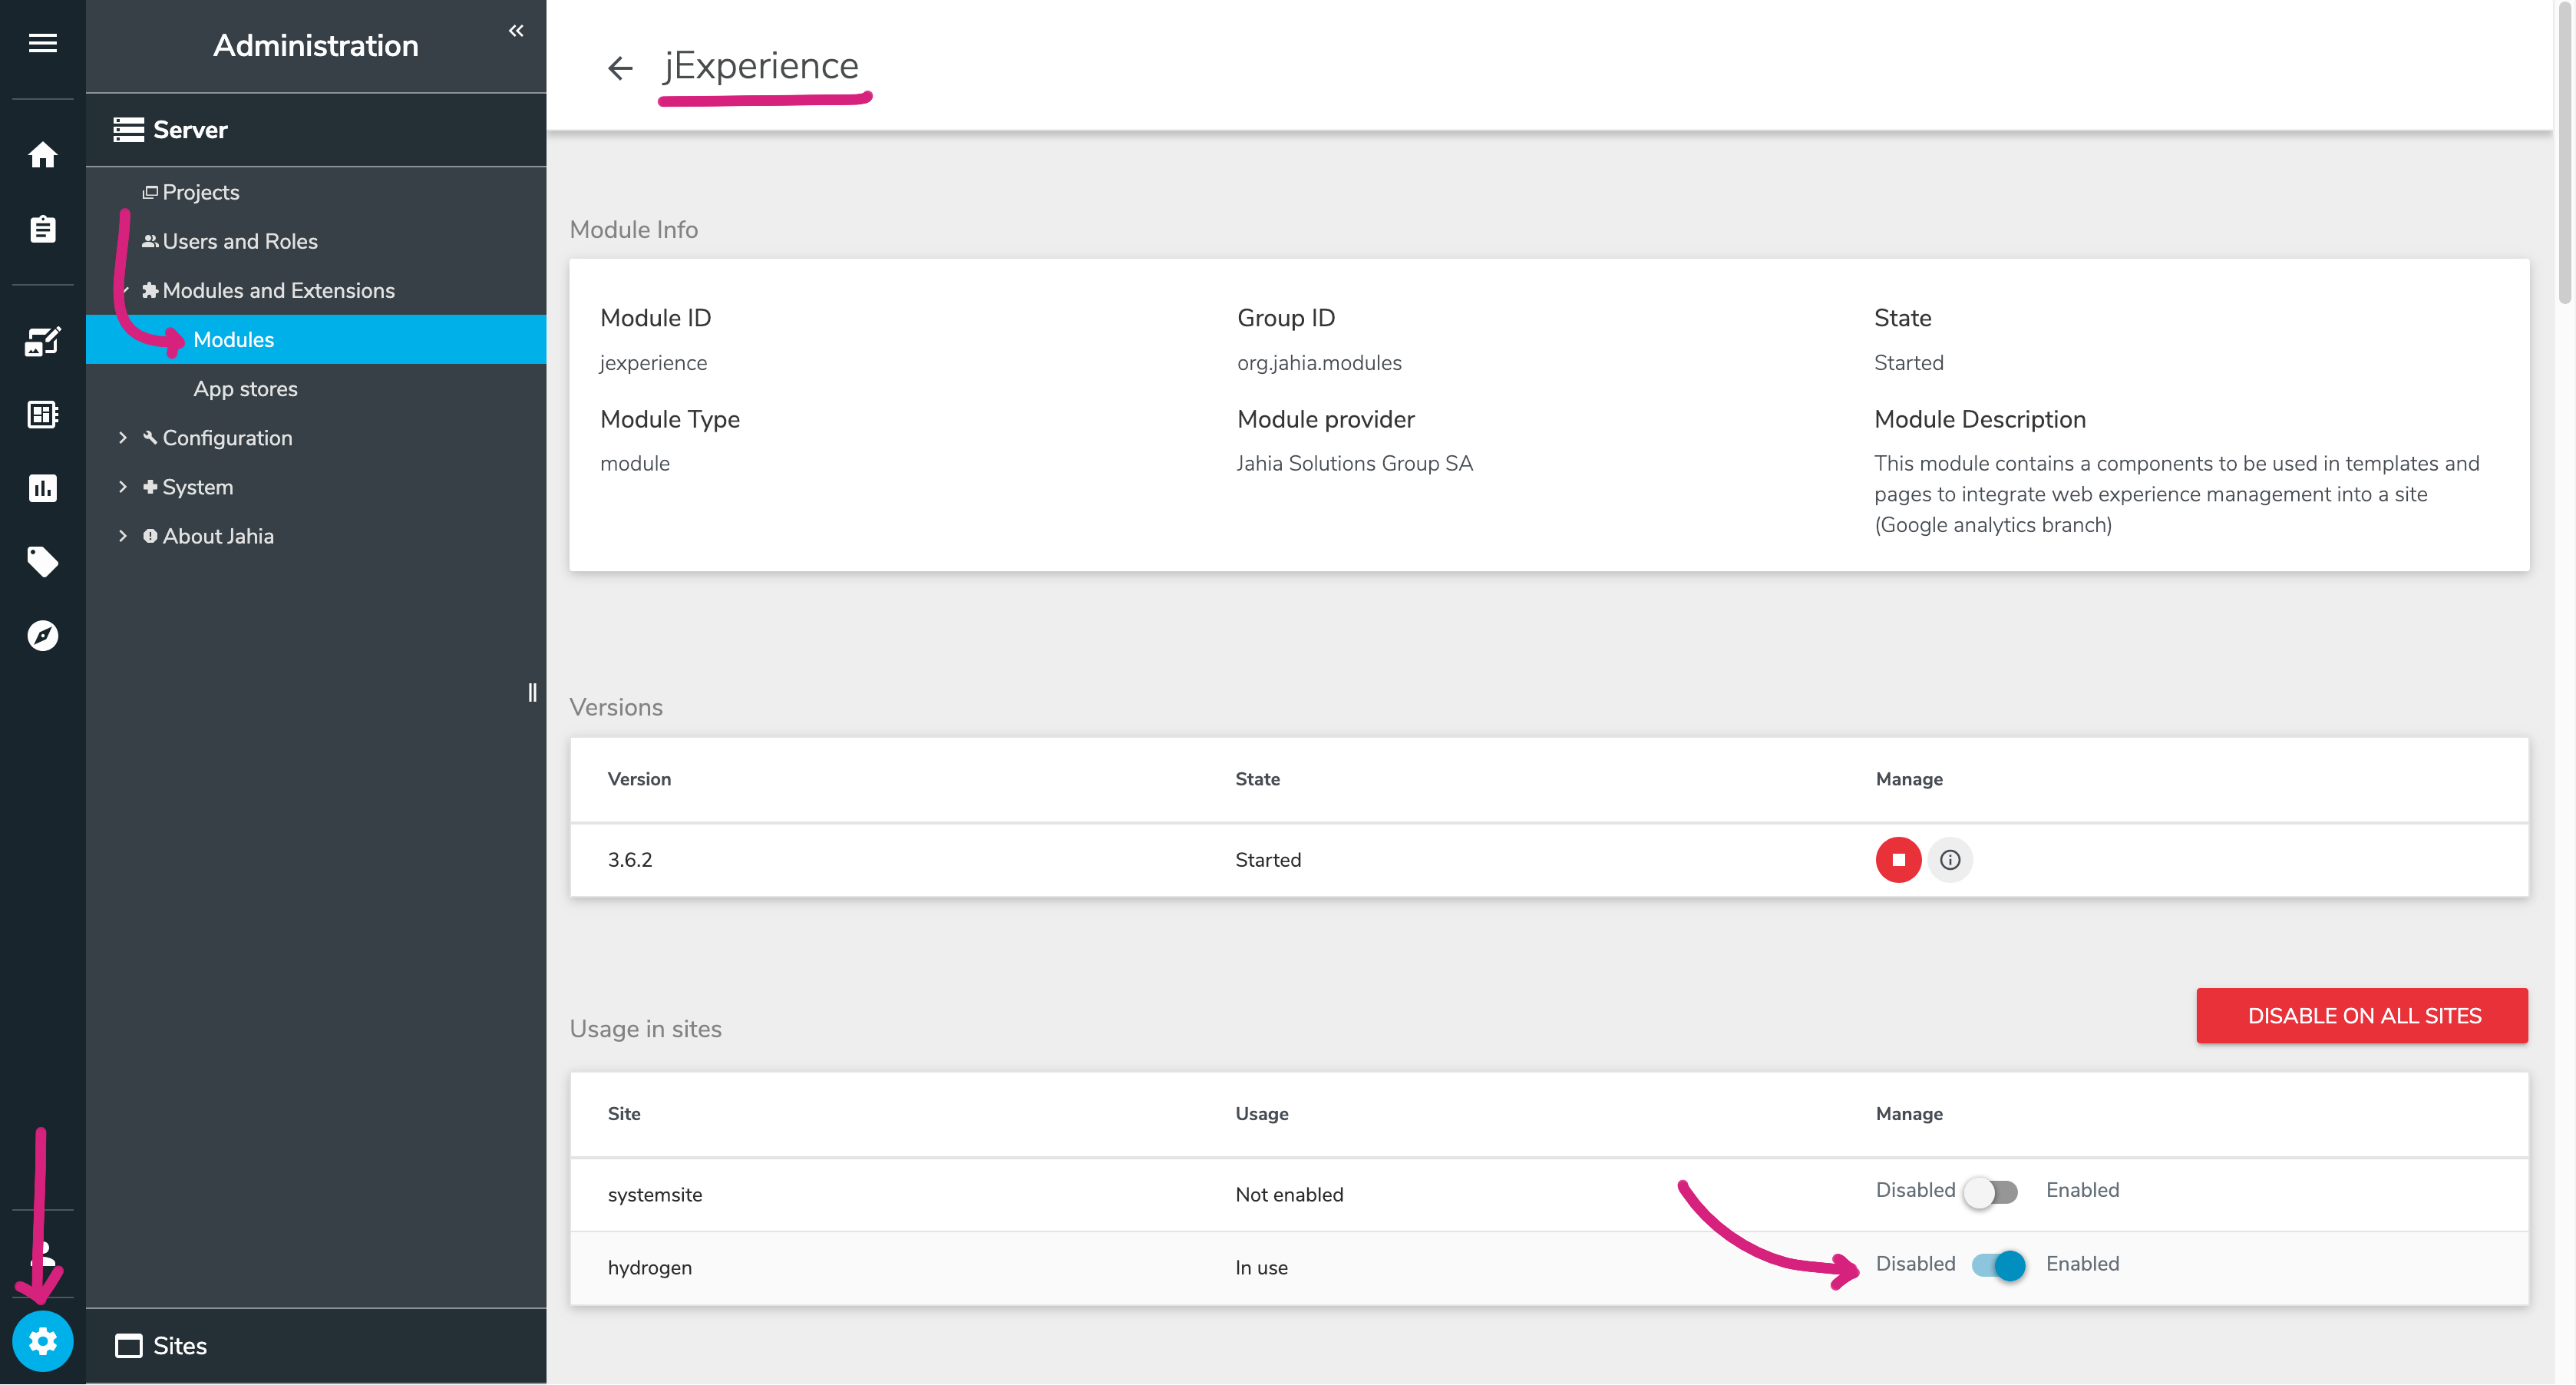
uninstallPreviousVersion: trueOnce done, run docker compose down jahia && docker compose up --wait to start the containers. You need to enable both jExperience and jExperience Dashboards to the website you are using. You can do this by going to Administration > Modules > jExperience > Usage in sites and checking the box next to your website. Do the same for jExperience Dashboards.
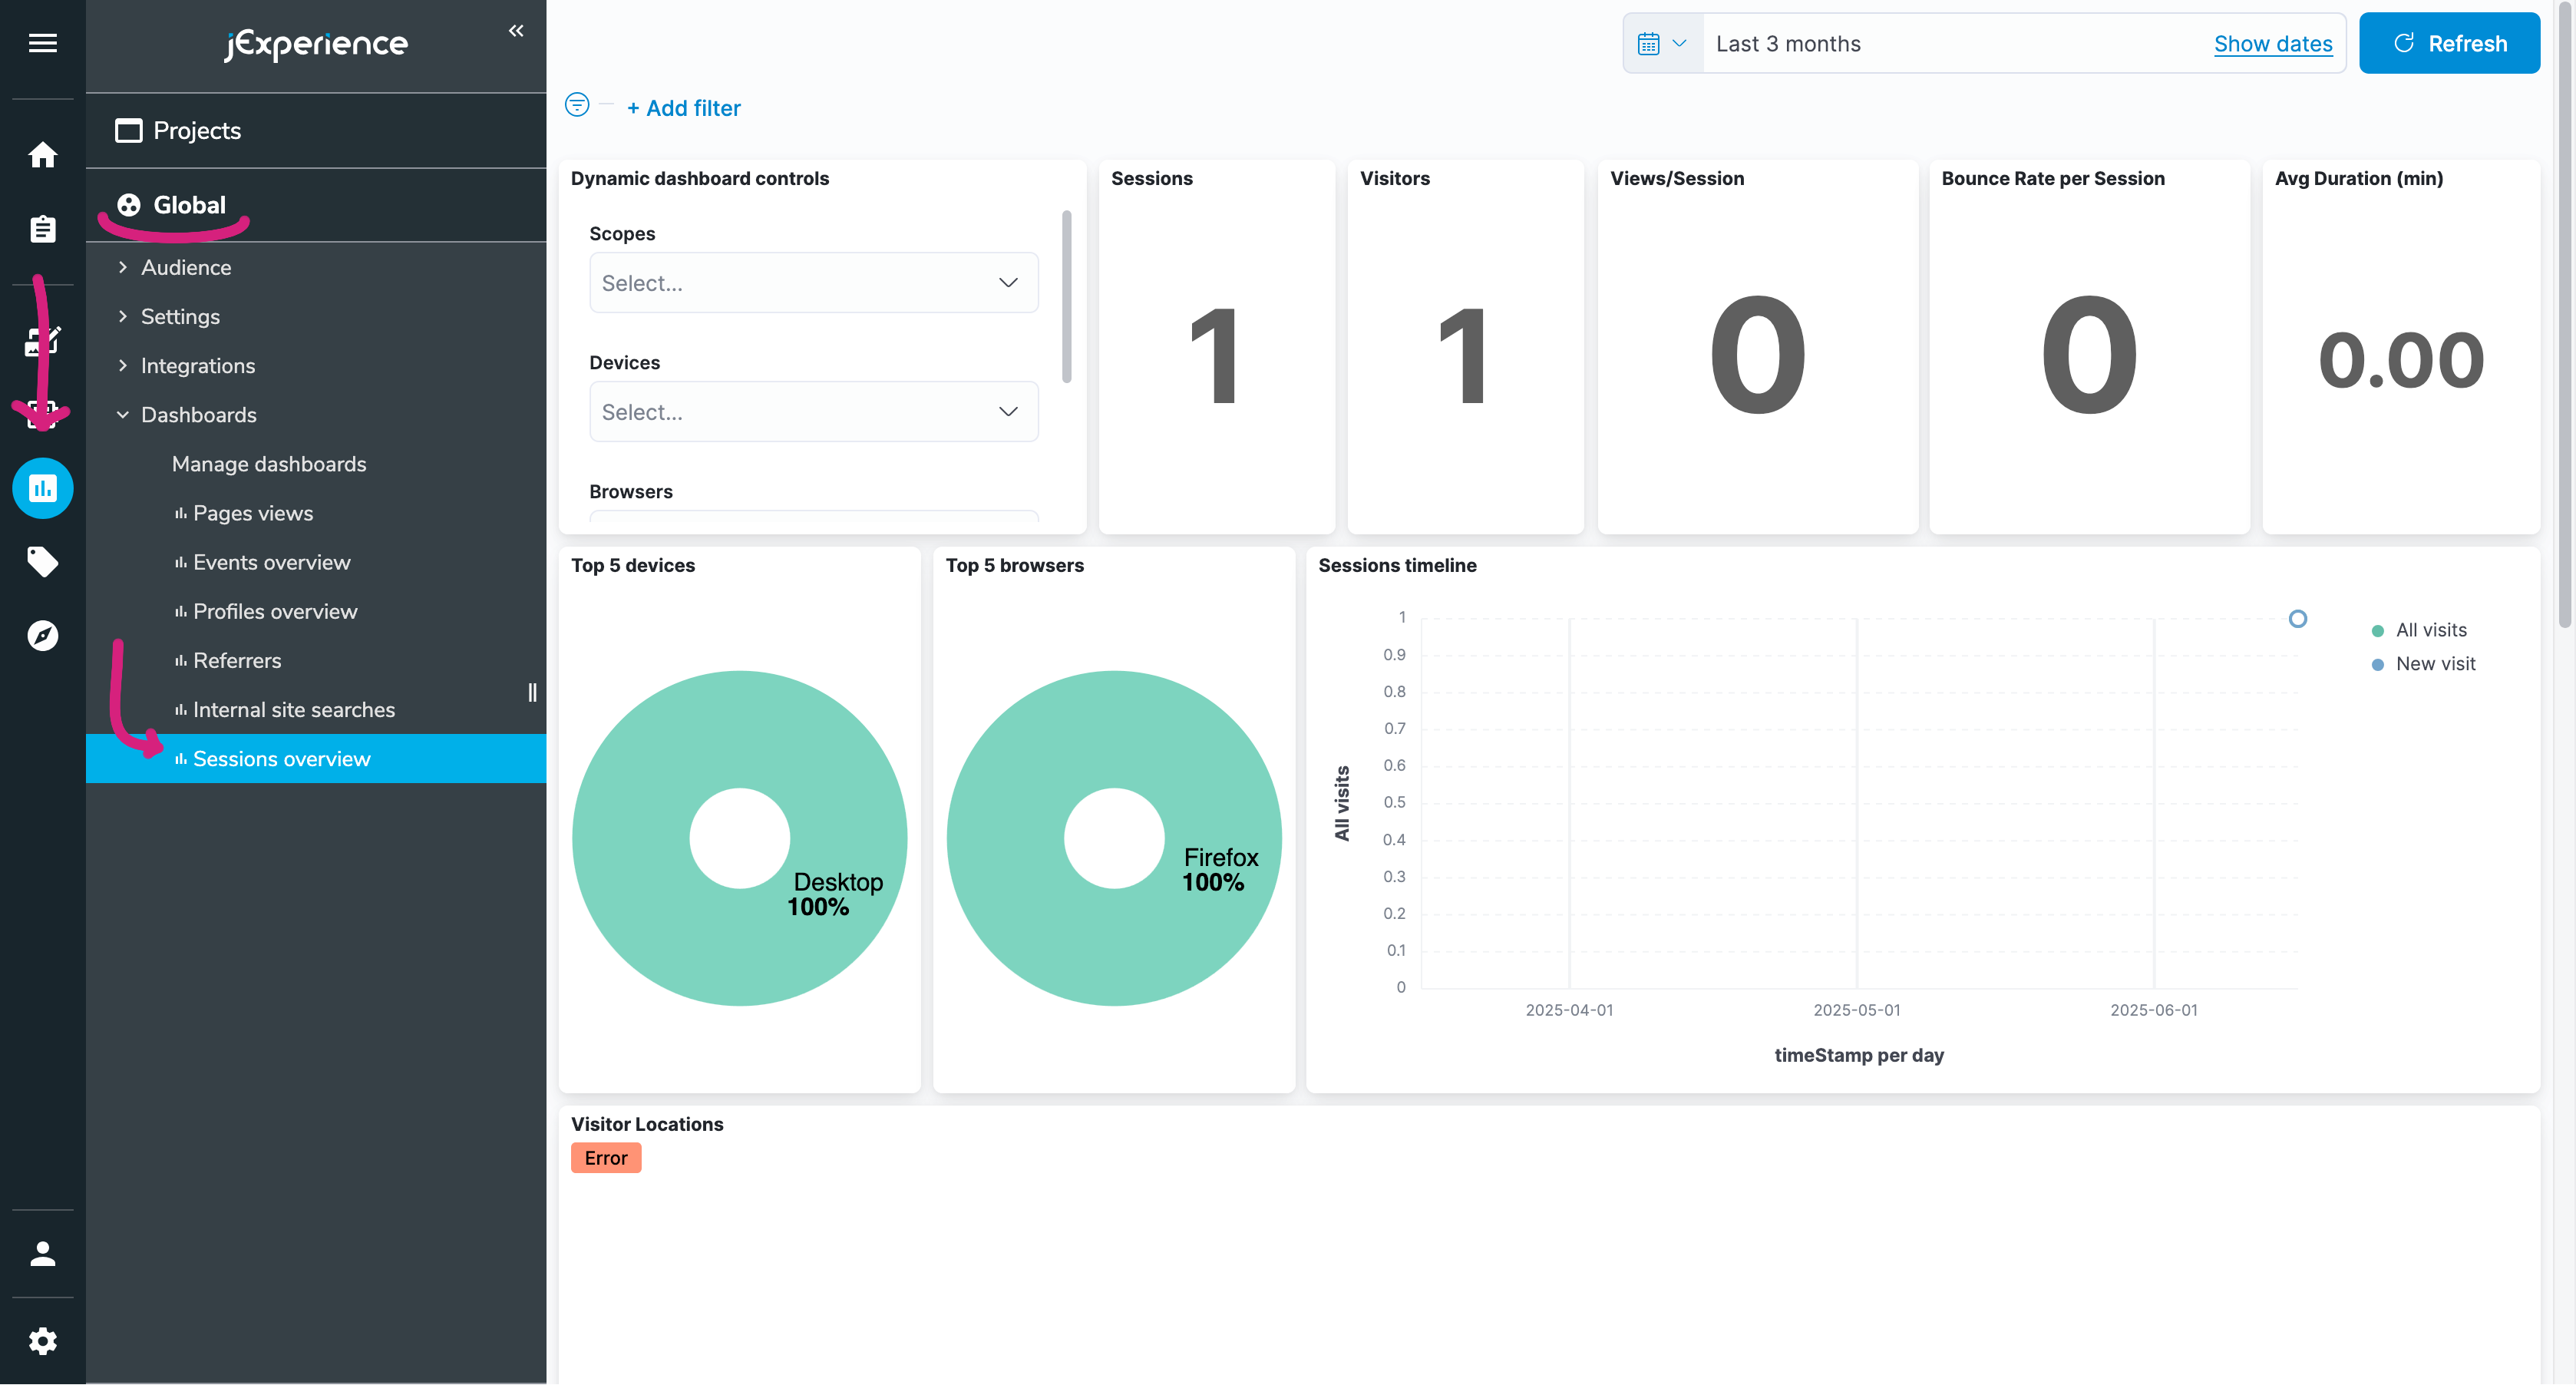
Get back to jContent (the edition mode for your website). If all went well, you should see a new tab in the vertical bar: it's jExperience. You may need to refresh the page. Click on it, and you should see the default dashboards shipped with jExperience:
In the rest of this guide, we will push data to jCustomer and create a custom dashboard to visualize it.
Pushing Data to jCustomer
When enabled on a website, jExperience will automatically inject a JavaScript object to pages that can be used to push data to it. This object is called window.wem, for Web Experience Manager. It can only be used in the browser.
Jahia is an open-source company and its DXP is no exception: we are the biggest contributors to the Apache Unomi project, which is the engine behind jCustomer. The window.wem object comes from the apache/unomi-tracker package, which can be read in detail to discover all the features it offers.
jCustomer events are created out of two things:
- A source, which is the starting point of the event. It is usually the page where the event happened, but it can be anything else.
- A target, which is usually the action taking place (a click, a form submission, a navigation).
The combination of the two creates an event, representing a visitor interaction, that can be sent to jCustomer. Replace the TODO in the handler function with the following code to create an event and send it to jCustomer:
// Replace TODO with this to push to jCustomer:
const source = wem.buildSourcePage();
const target = wem.buildTarget("feedback", "click", { happy });
const event = wem.buildEvent("click", target, source);
wem.collectEvents({ events: [event] });
The source of our click event is this page the user is on, and the target is the action of clicking on the button. The interaction is of id feedback and of type click, with additional data: the value of happy. The event is then sent to jCustomer using the collectEvents method.
Once deployed, clicking the Yes or No button should send events to jCustomer. We will check that they are properly received in the next section. Click Yes and No a few times to generate some data.
Visualizing Data in Kibana
The database used by jCustomer is Elasticsearch, which is often paired with Kibana, a visualization tool. We will use Kibana to visualize the data we just sent to jCustomer.
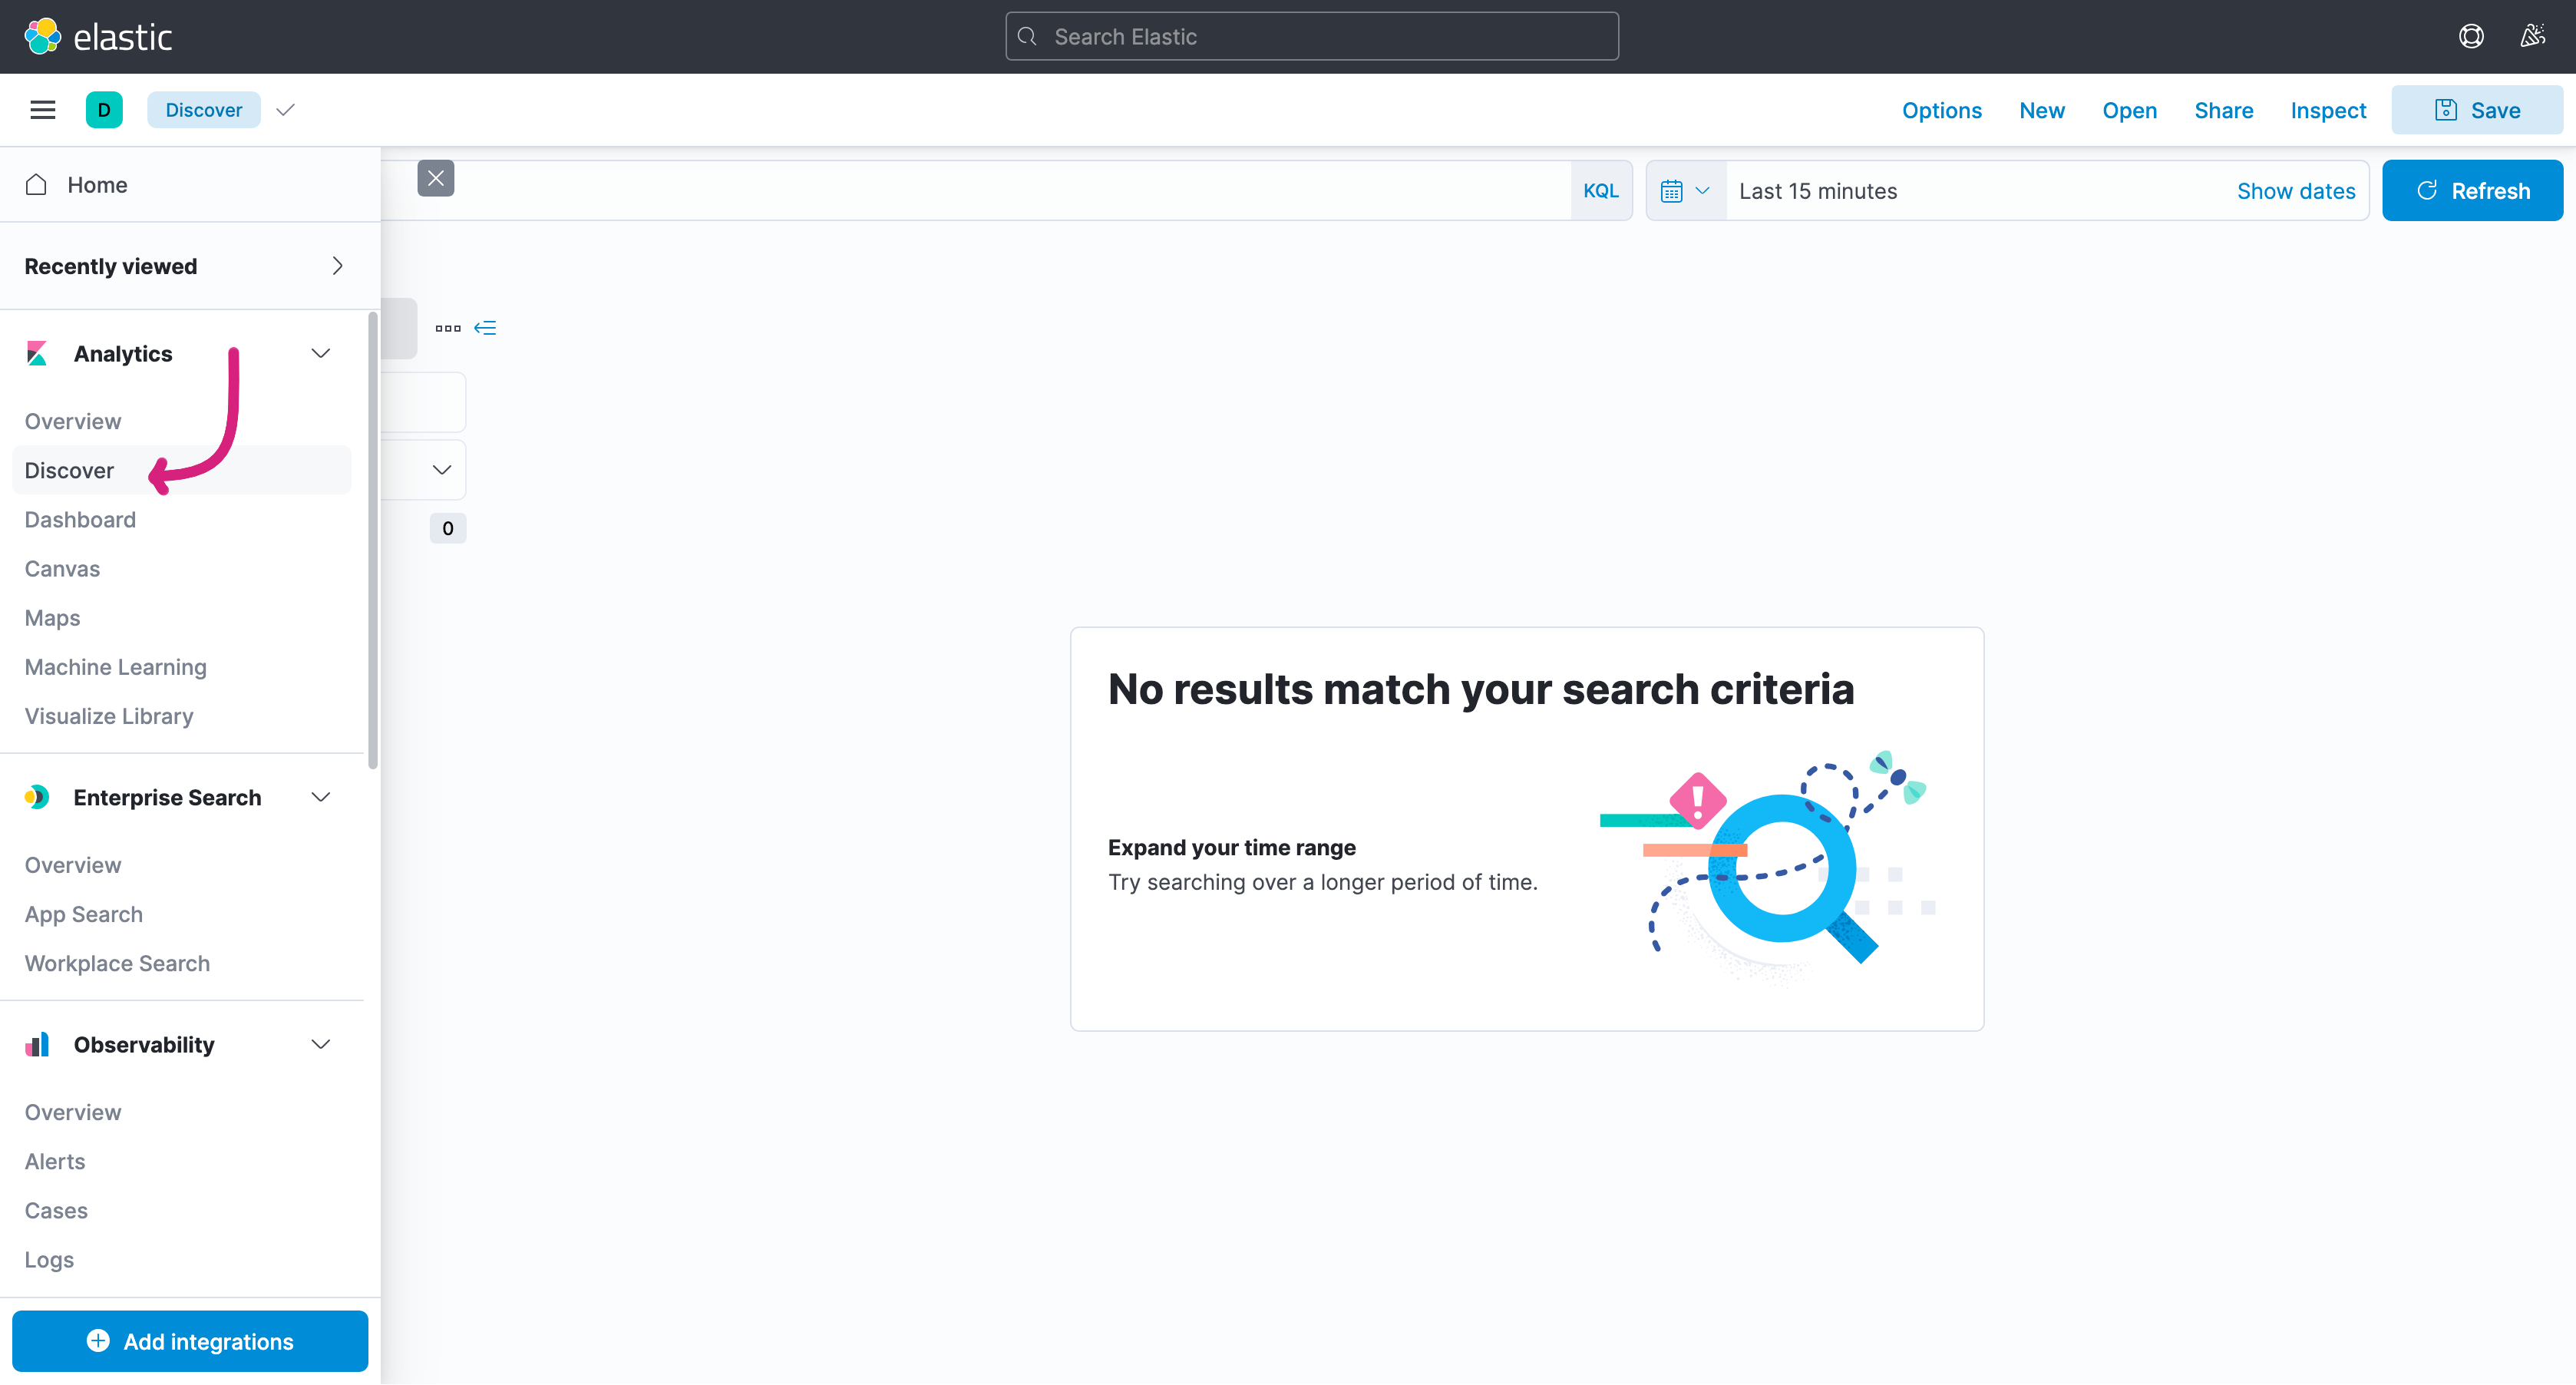
Open localhost:5601 in your browser, and go to the Discover tab:
Select the *-event index and open a bigger time range to see all the events jCustomer received.
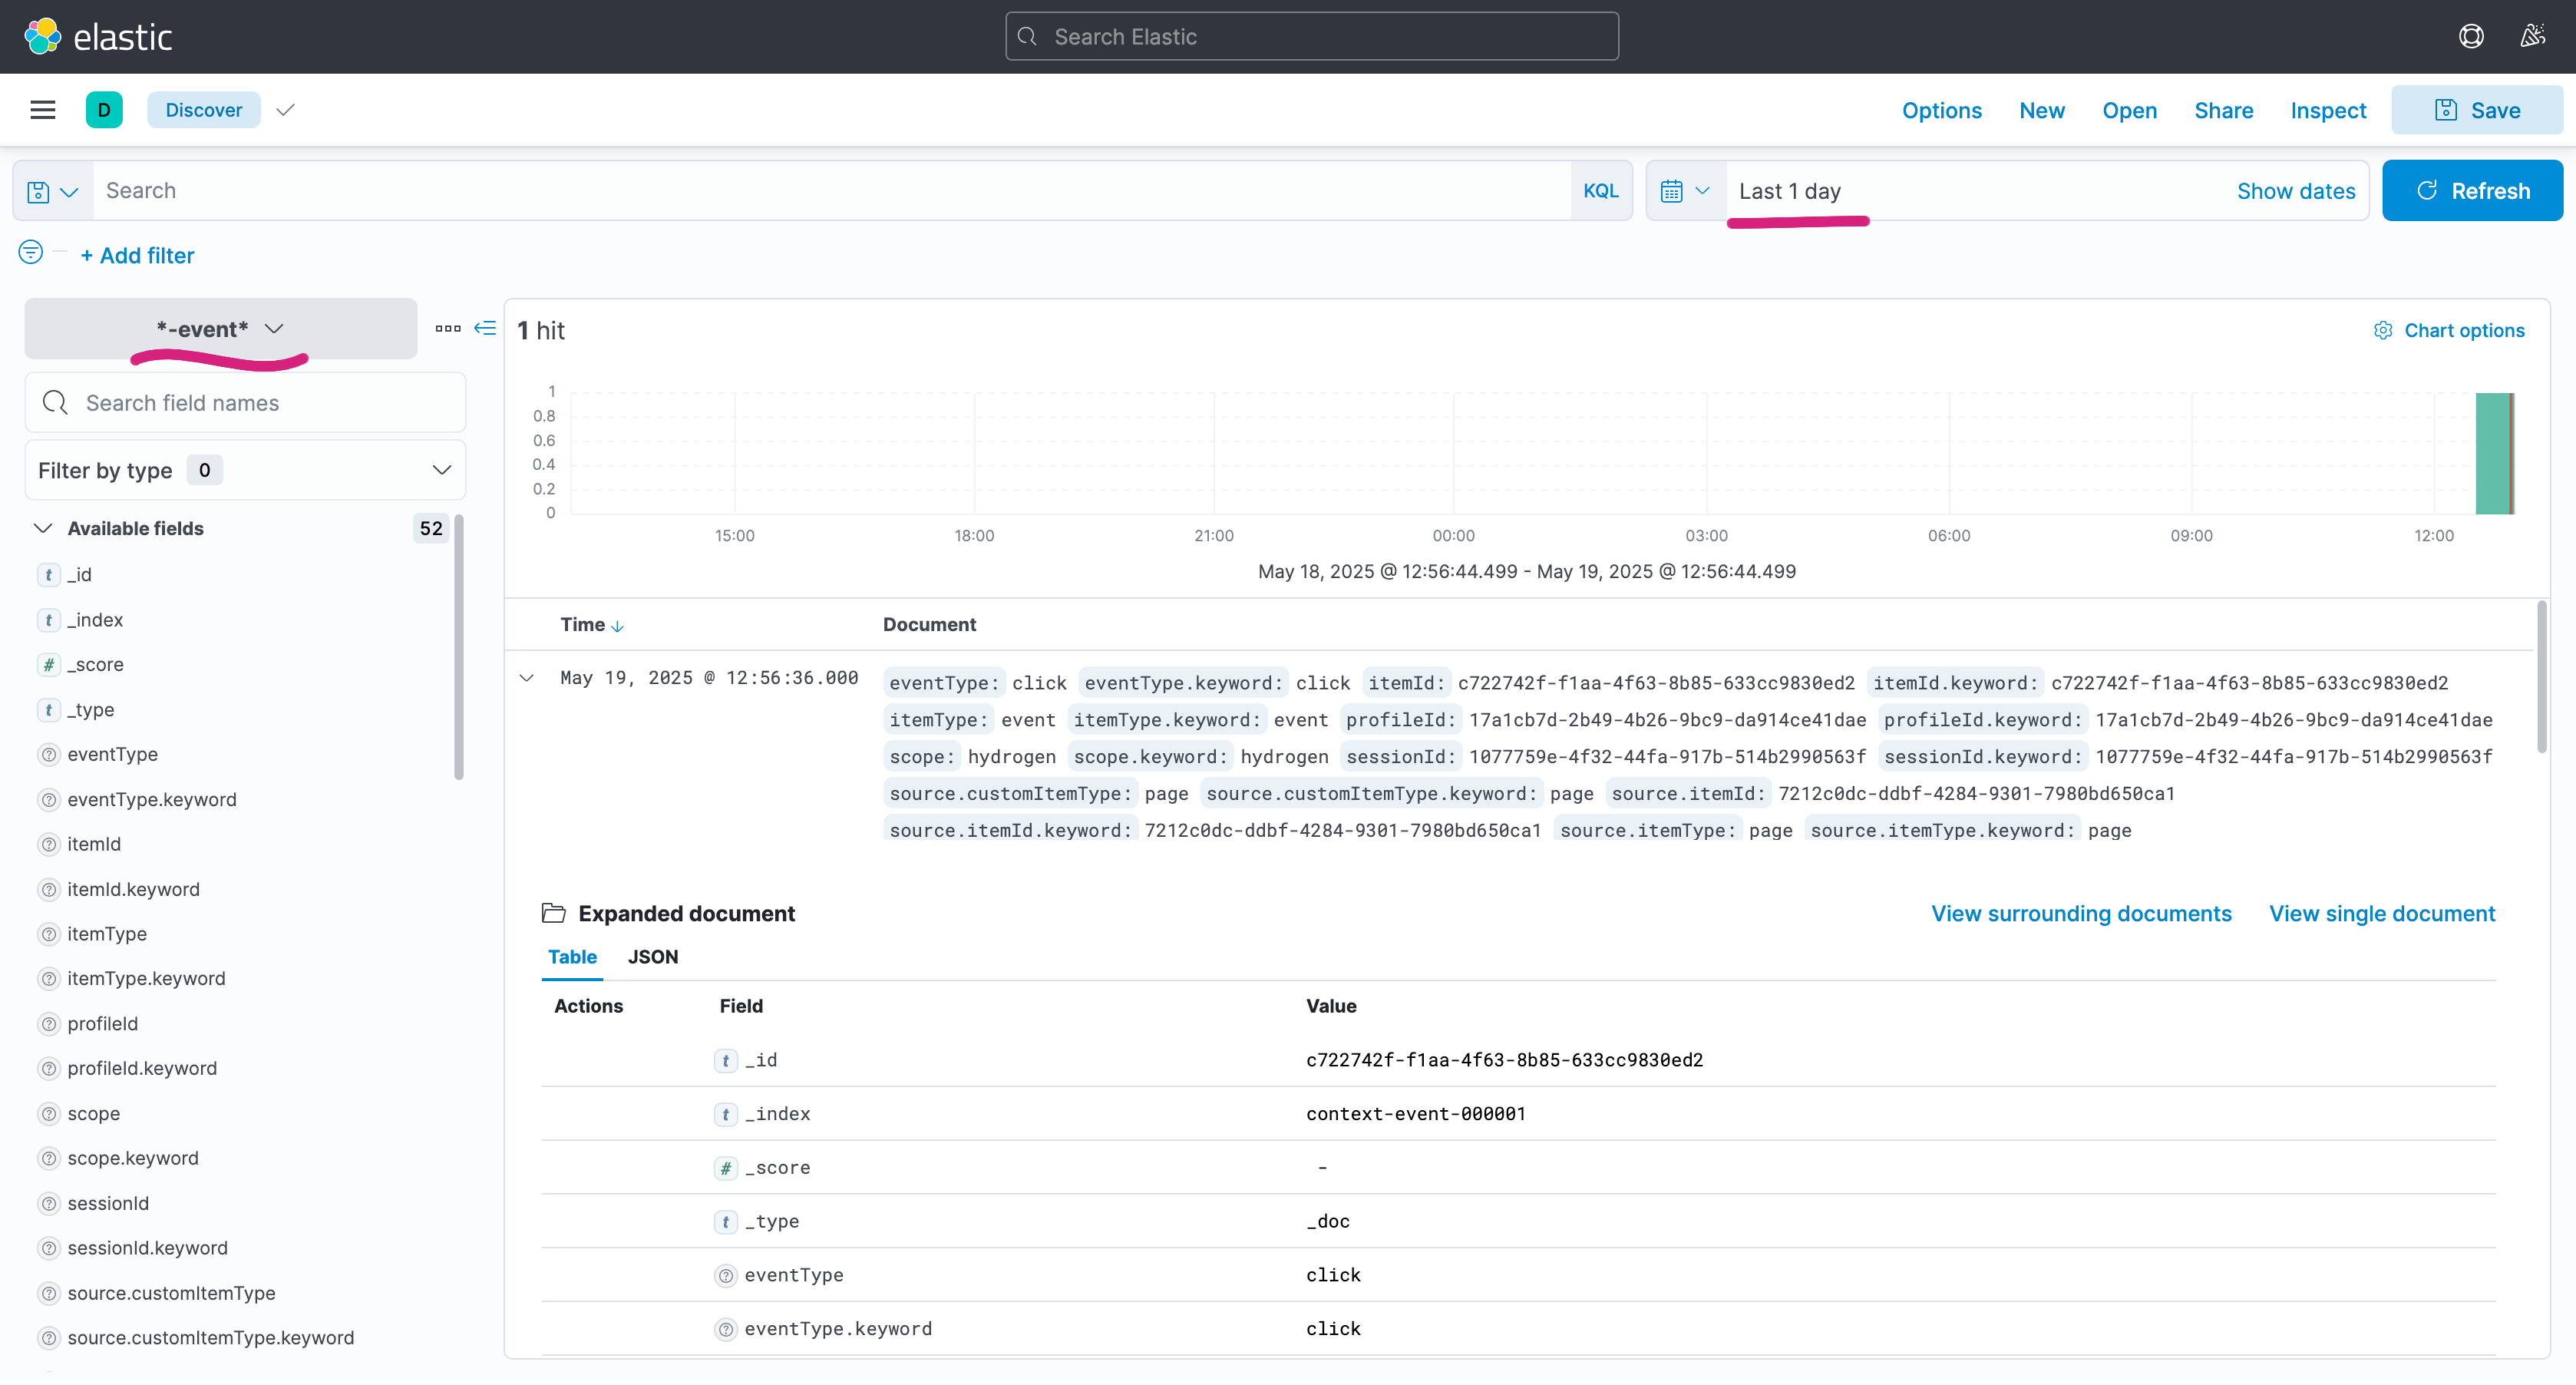
Browse an event created by your feedback form to see the content of the event. You should see something like this:
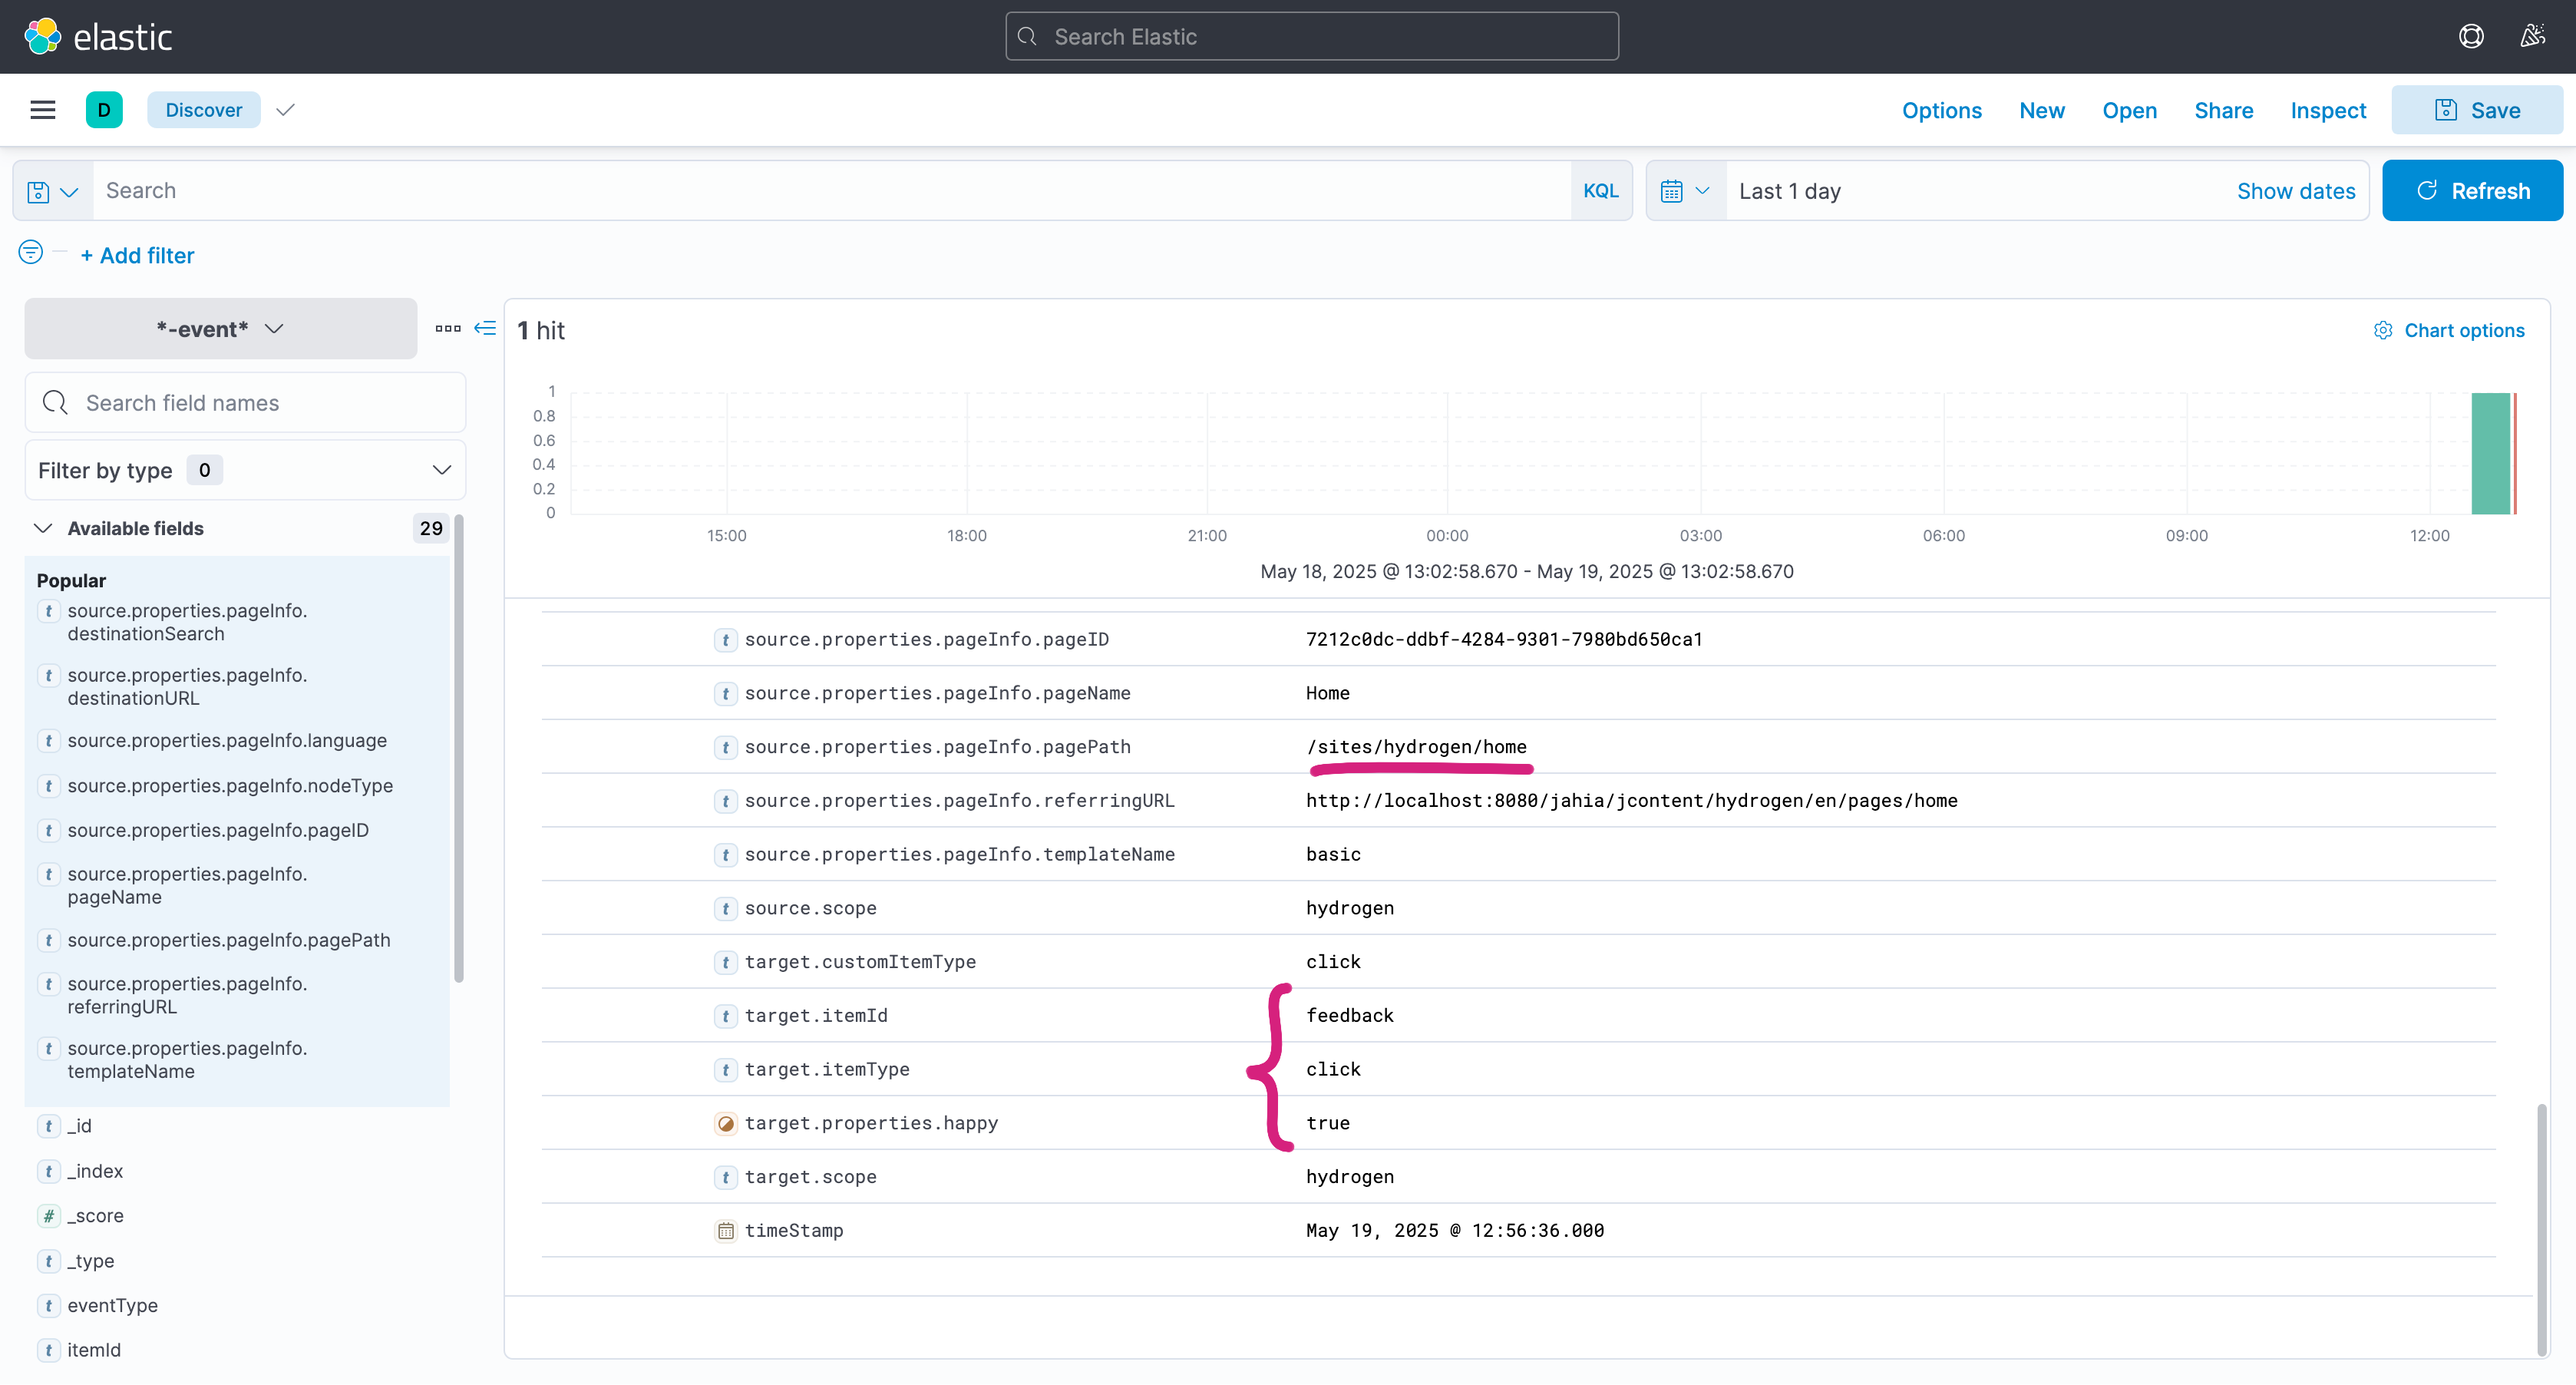
You can see the source and target of the event:
- The source is the page where the event happened, one interesting property is the
pagePathproperty, which is the path of the page in the JCR. - The target is the action that happened: the ID is
feedback, the type isclick, and the additional data is the value ofhappy(true or false).
We will create a custom dashboard to visualize the latest feedbacks and the trends of the feedback form.
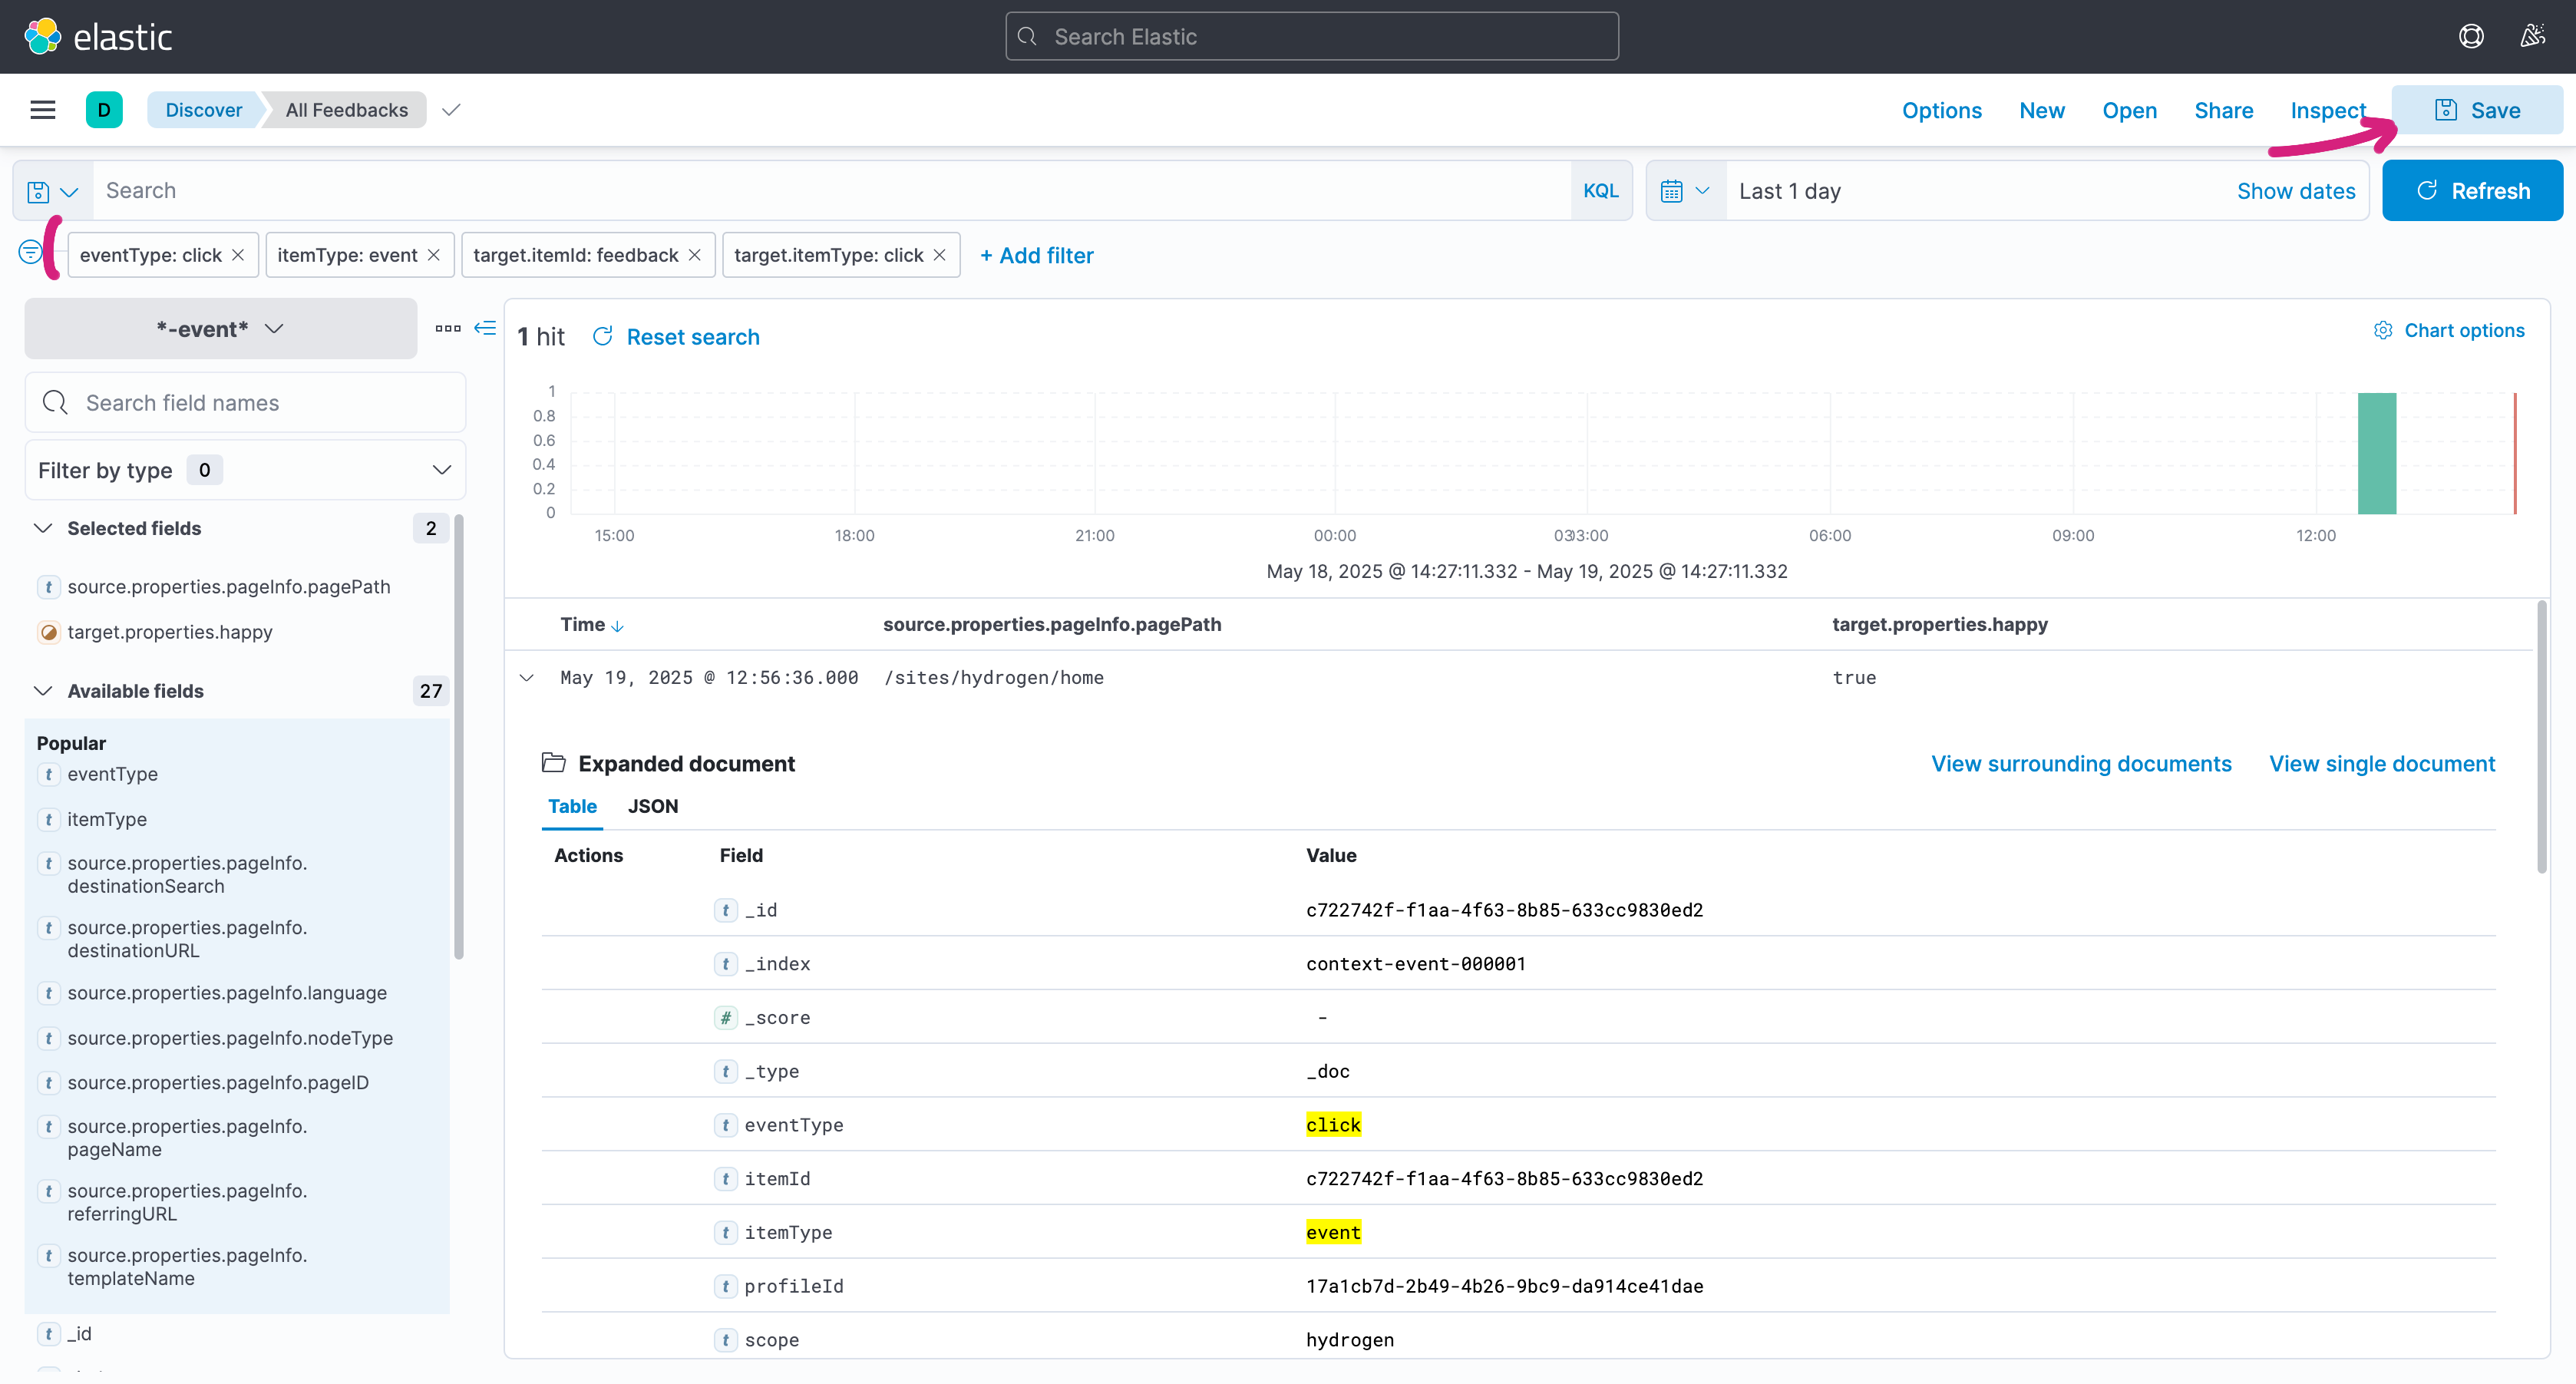
Click the ⨁ icon next to the following fields to create a persisted search:
eventType(should beclick)itemType(should beevent)target.itemId(should befeedback)target.itemType(should beclick)
Once done you should see the 4 fields listed under the search bar.
You can click the ≡🜨 icon next to the following fields to make the table easier to understand without needing to extend the rows:
source.properties.pageInfo.pagePathtarget.properties.happy(should betrueorfalse)
Click the Save button and give it a name, for instance All Feedbacks.
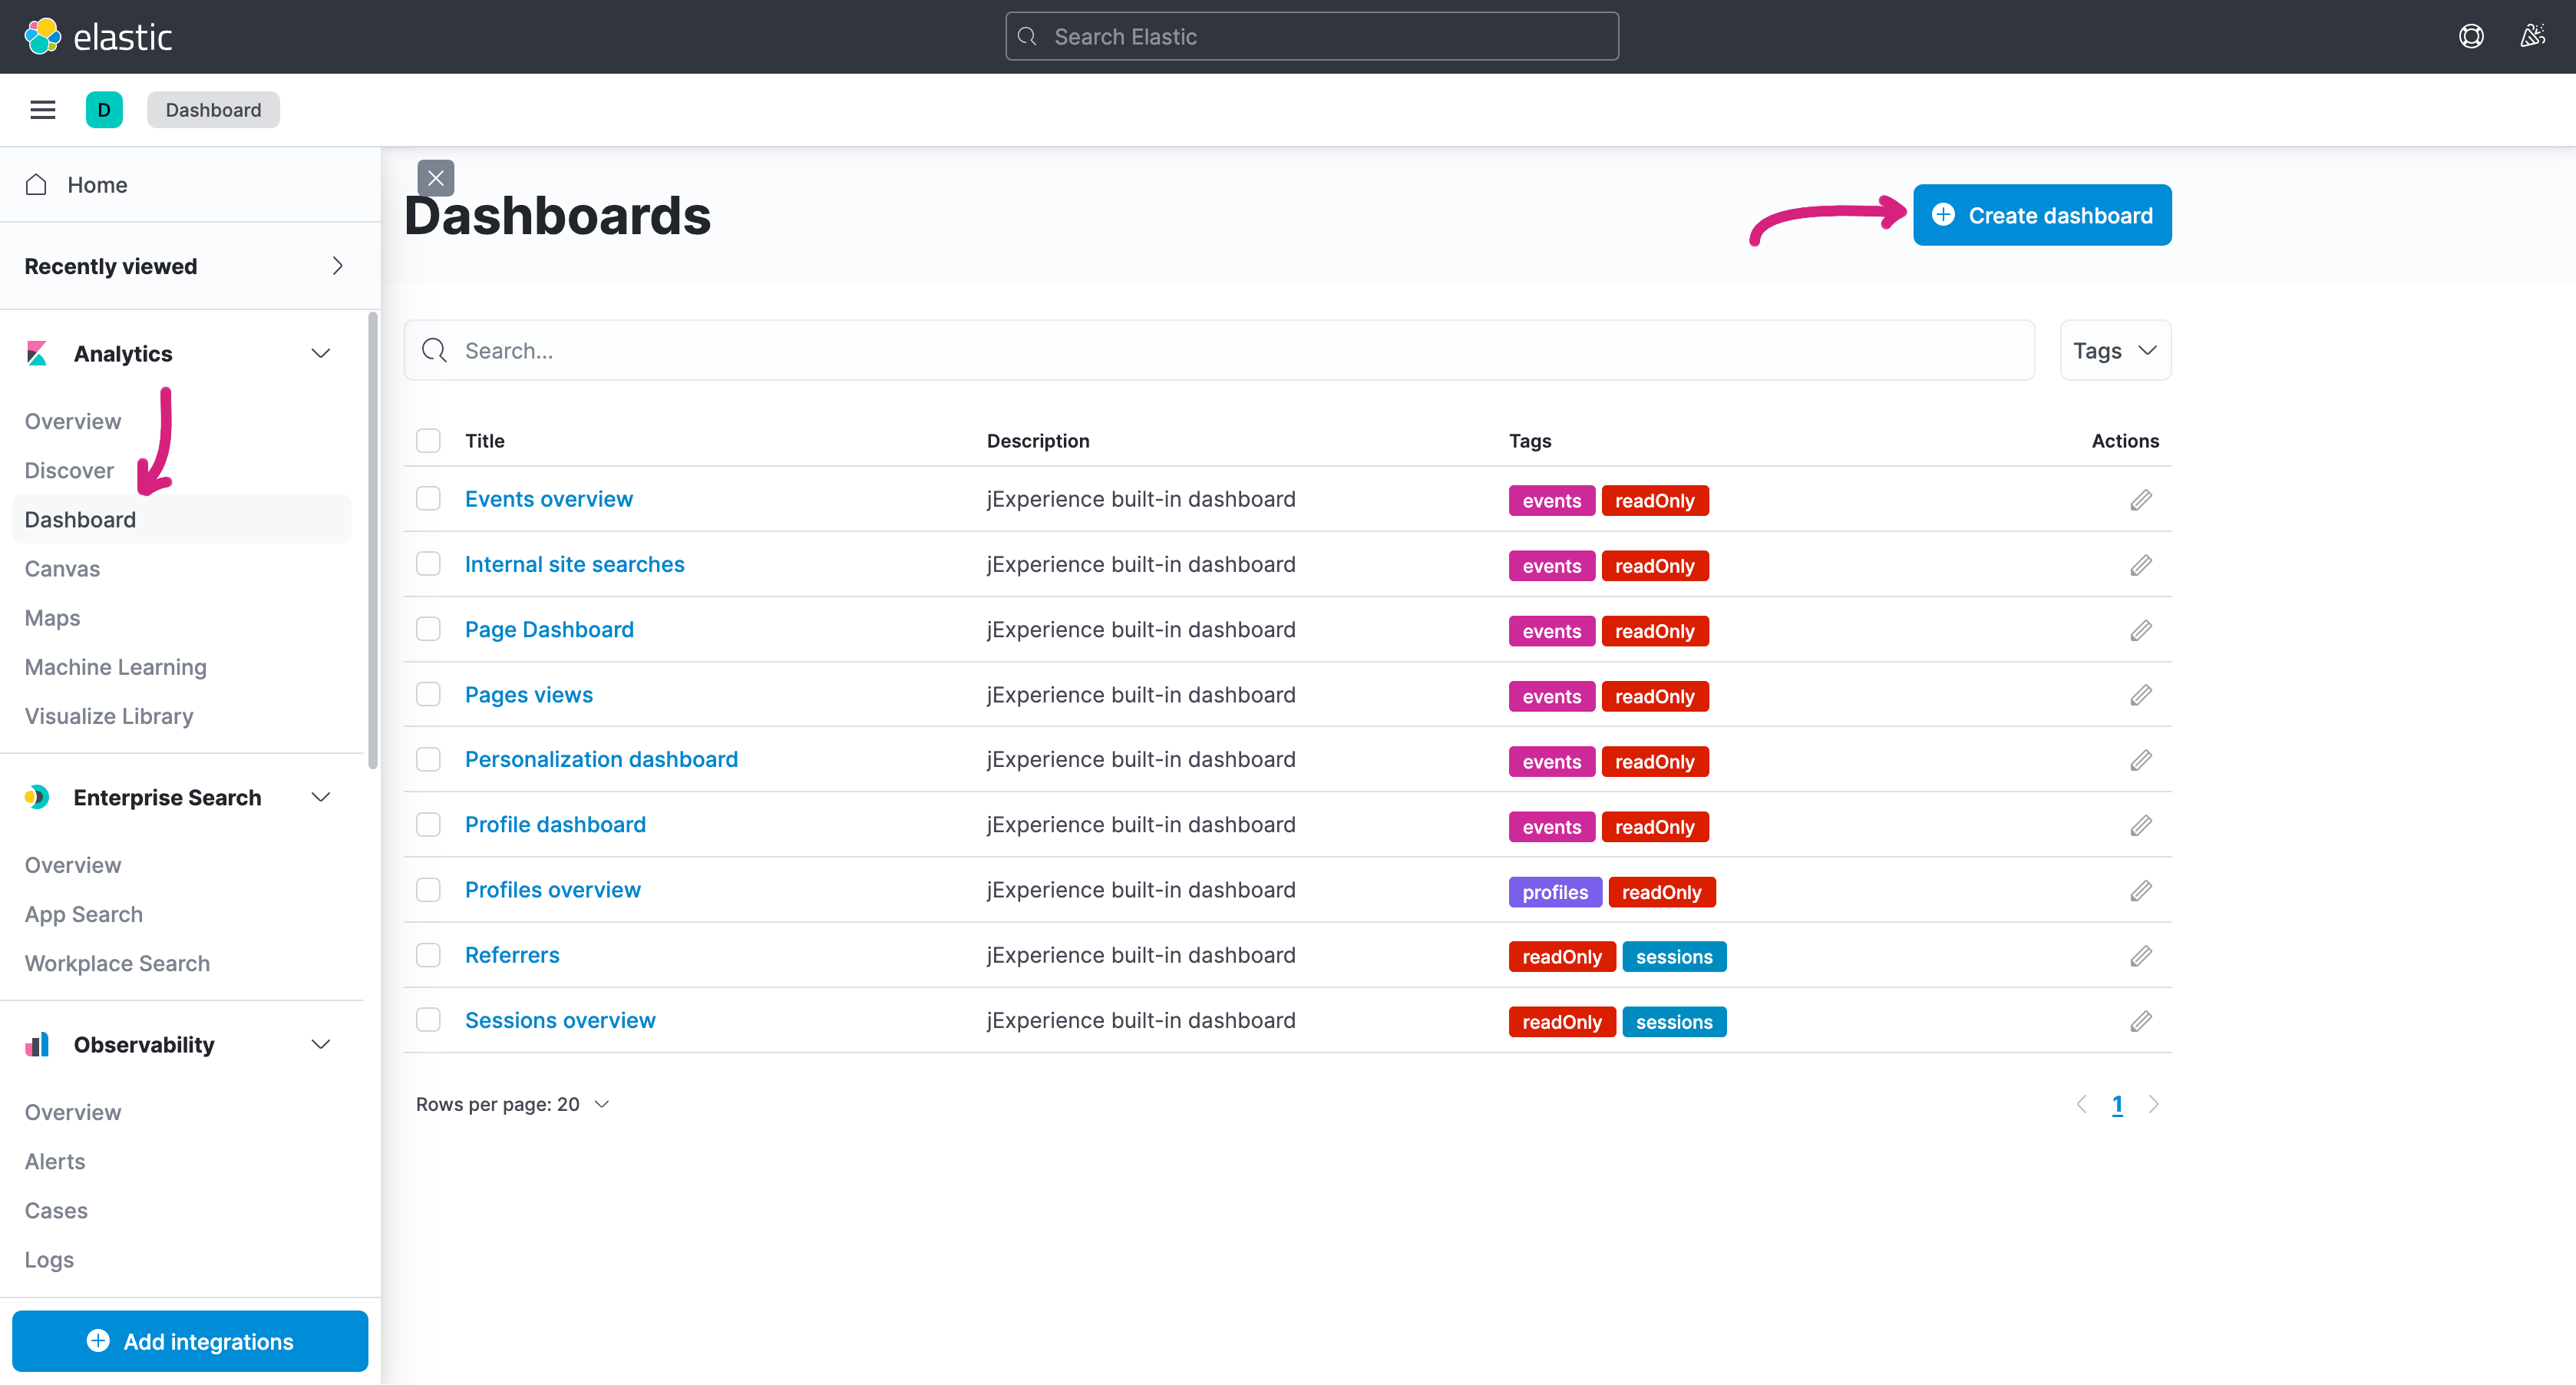
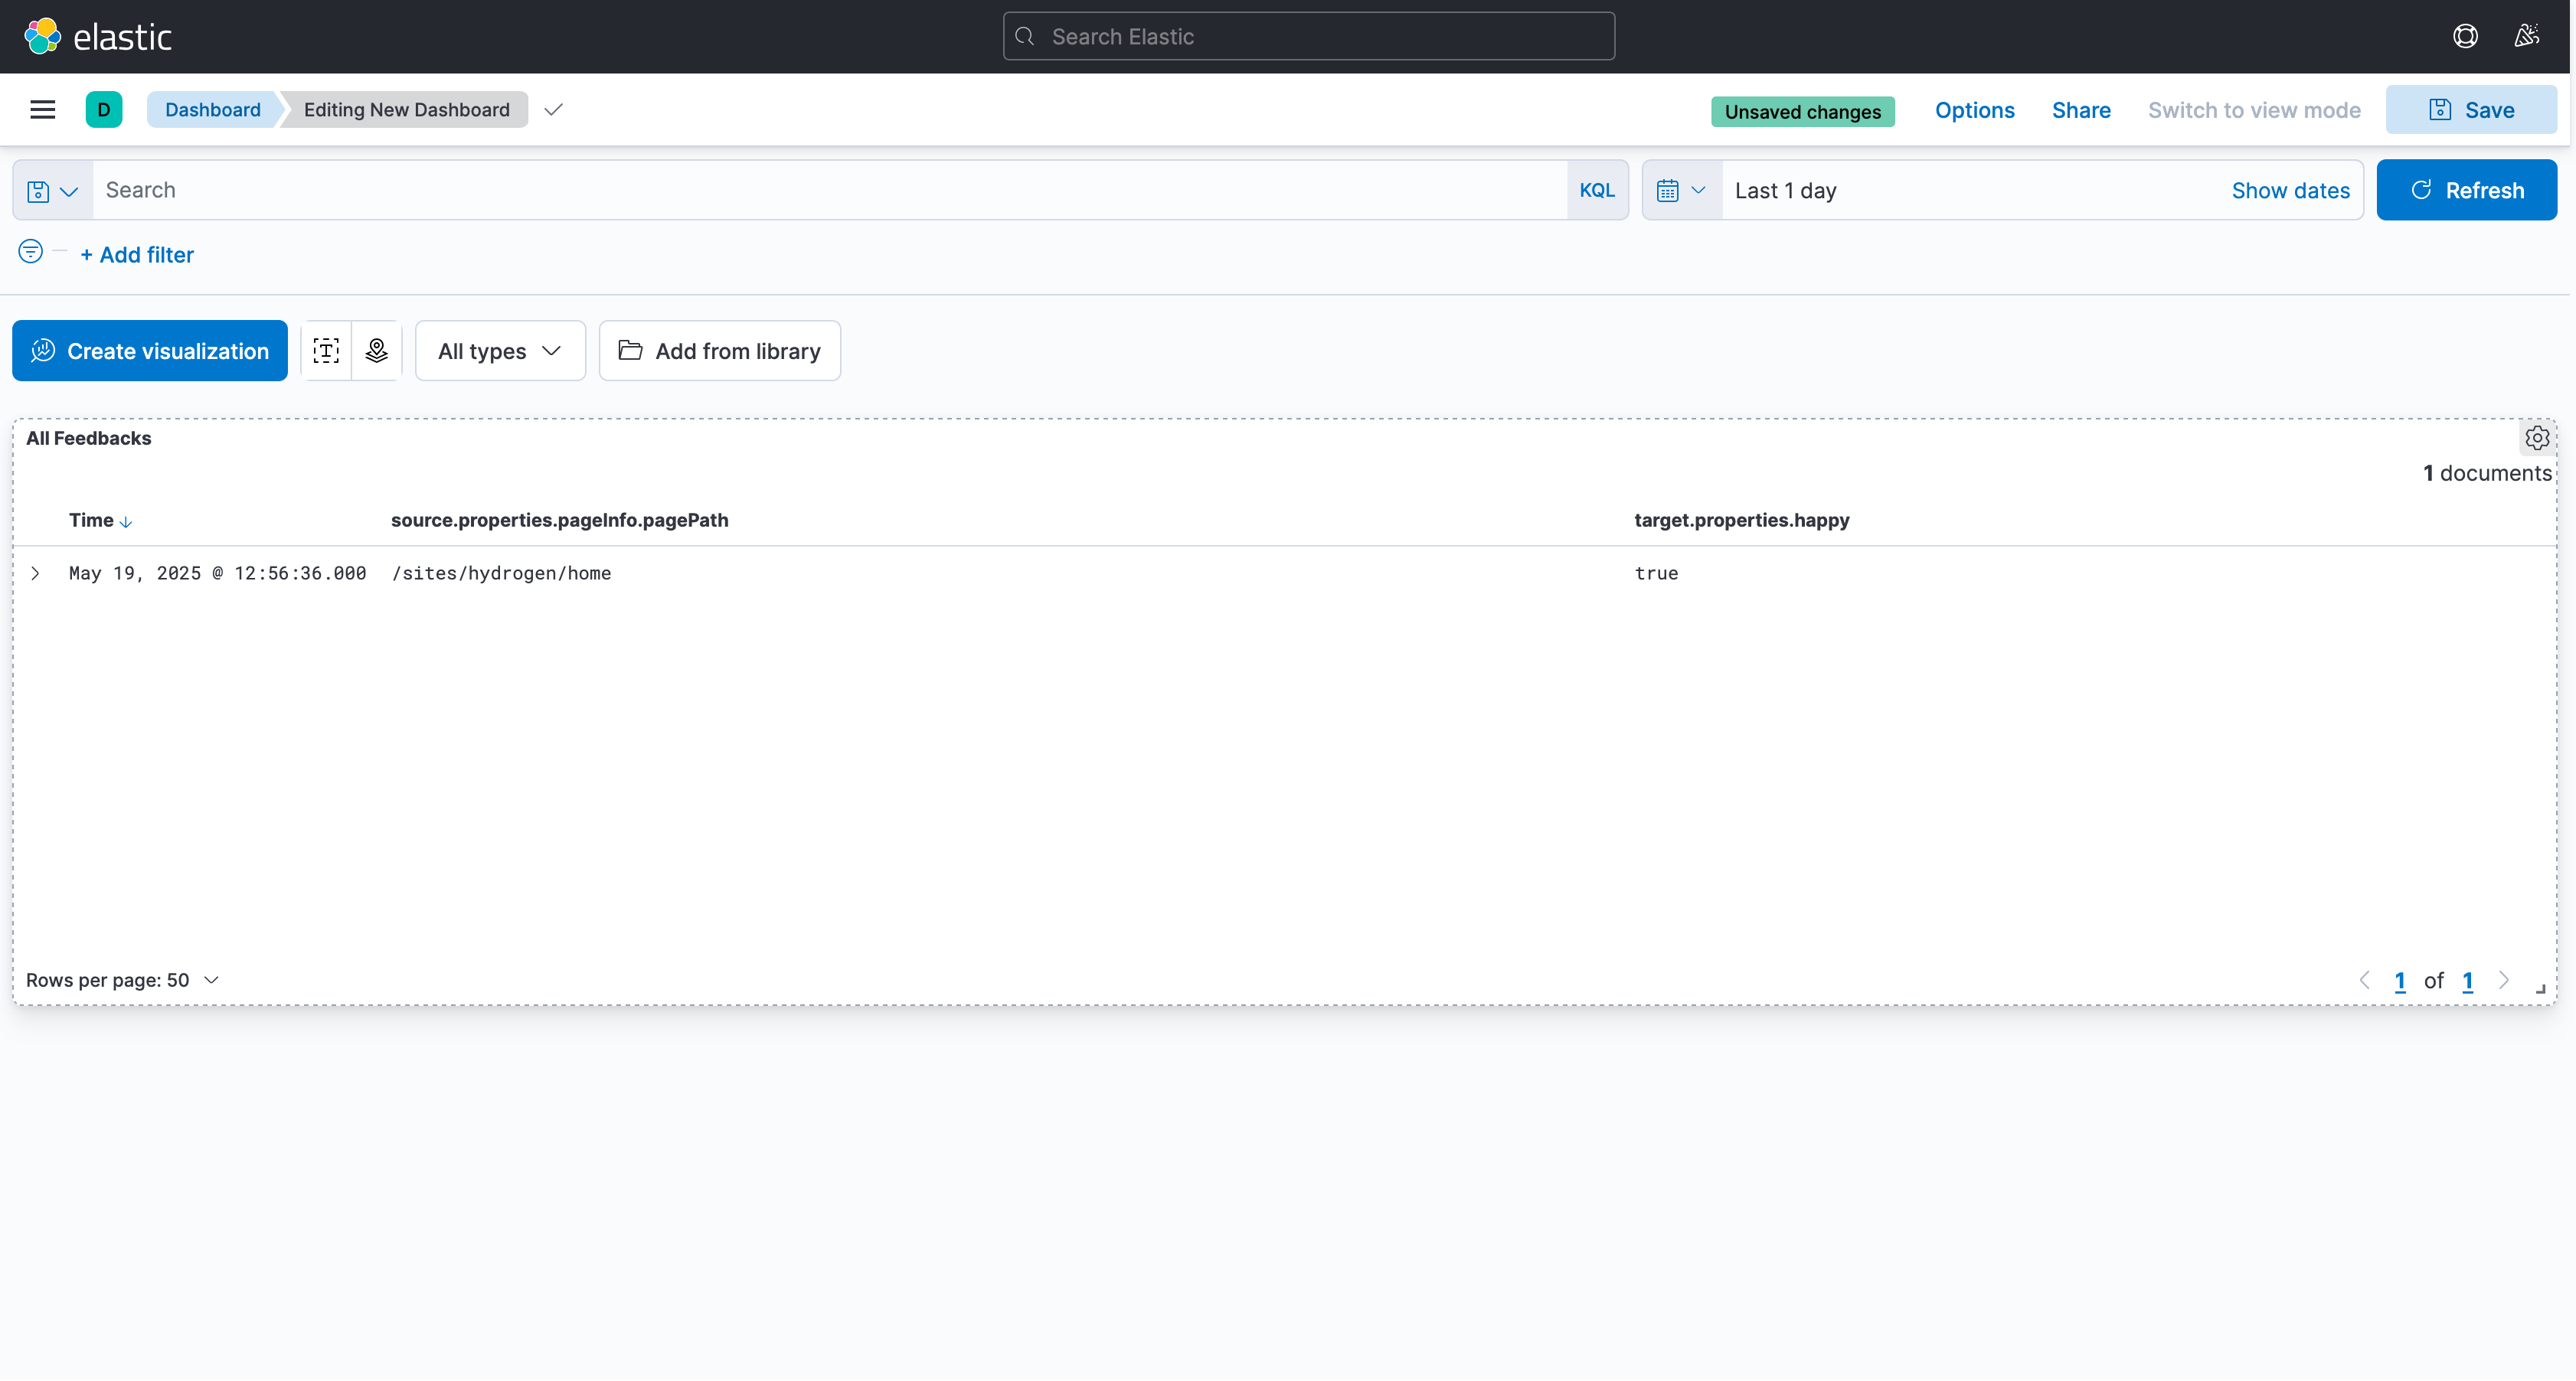
Browse the interface to create a new dashboard. Click Create dashboard:
We'll start with a basic list of incoming feedbacks: click Add from library and select the search you just created. You should see a table with all the feedbacks you sent to jCustomer:
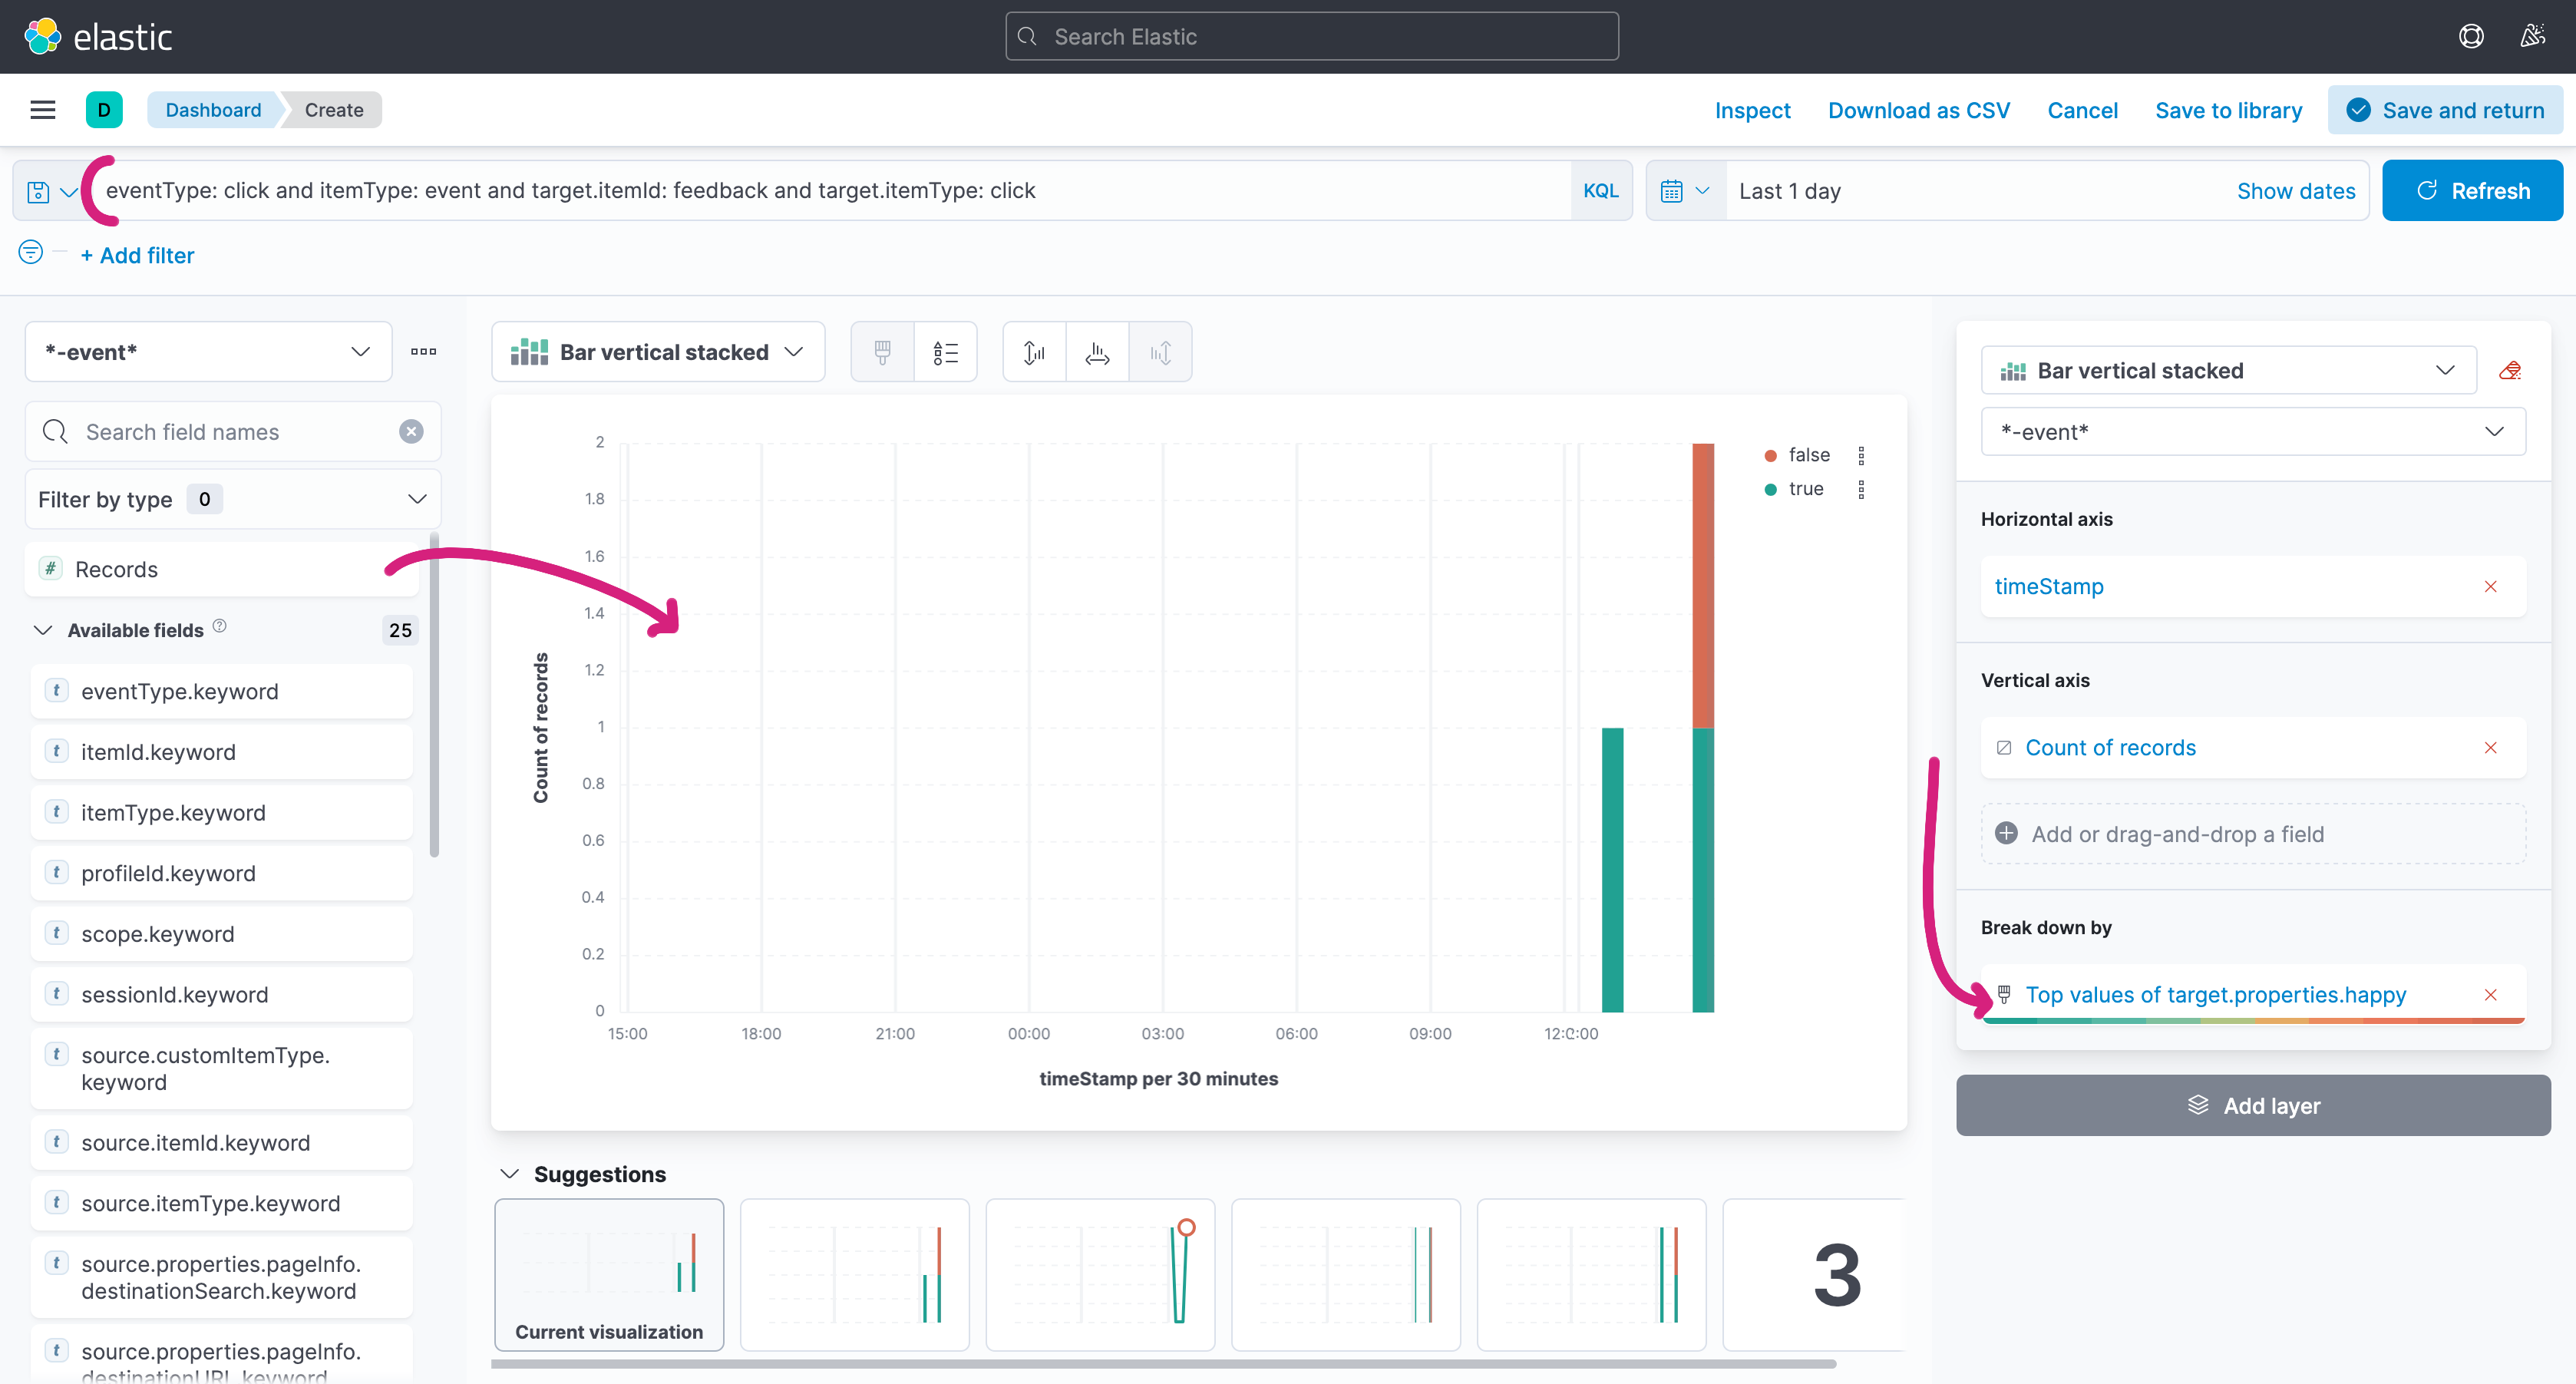
Let's create a stacked bar chart to visualize the global satisfaction of users. Click Create visualization and paste eventType: click and itemType: event and target.itemId: feedback and target.itemType: click into the search bar.
This query is the same one as we did earlier by clicking the filter buttons, but as KQL, the Kibana Query Language. It allows to create very complex queries if you ever need to. You can read the KQL documentation for more information.
Drop Records onto the central panel to create a new visualization based on the search. In the right panel, in Break down by select target.properties.happy. You may use the Status color palette to get red and green colors for the two values.
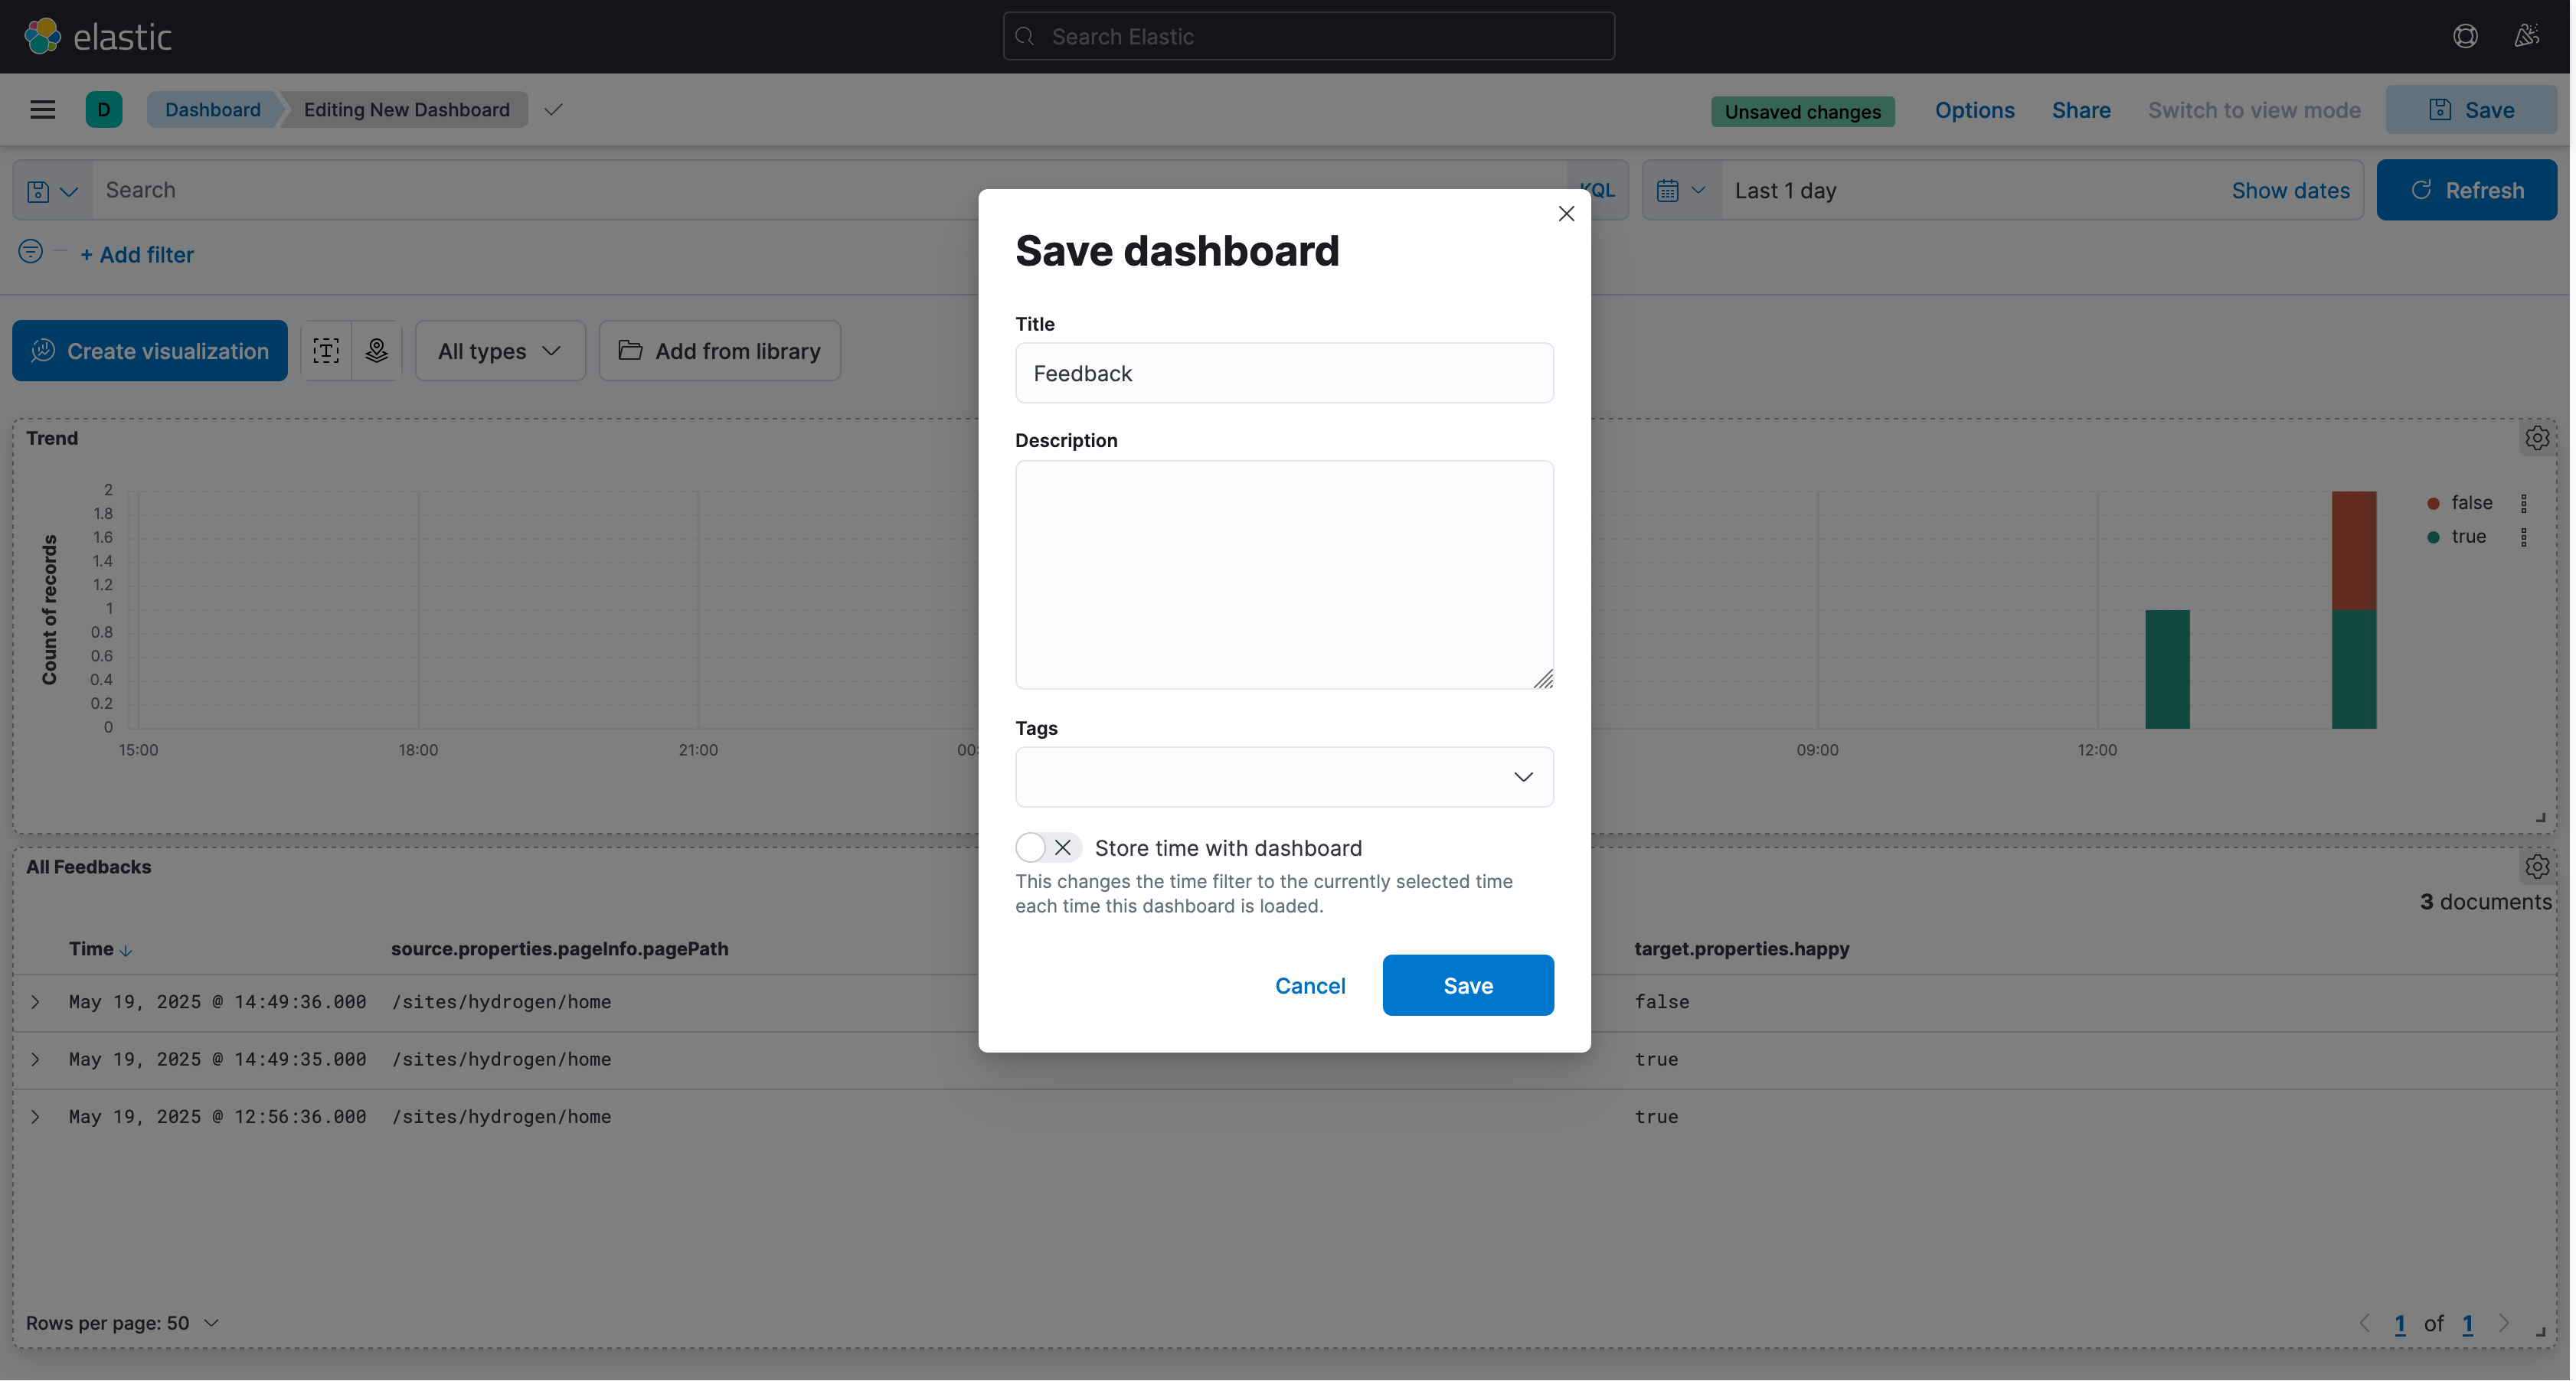
Click Save and return to get back to your dashboard. Arrange and name your graphs as you like, and click Save to save your dashboard. The name of the dashboard will be the name of the entry on Jahia's side, so make sure to name it something meaningful.
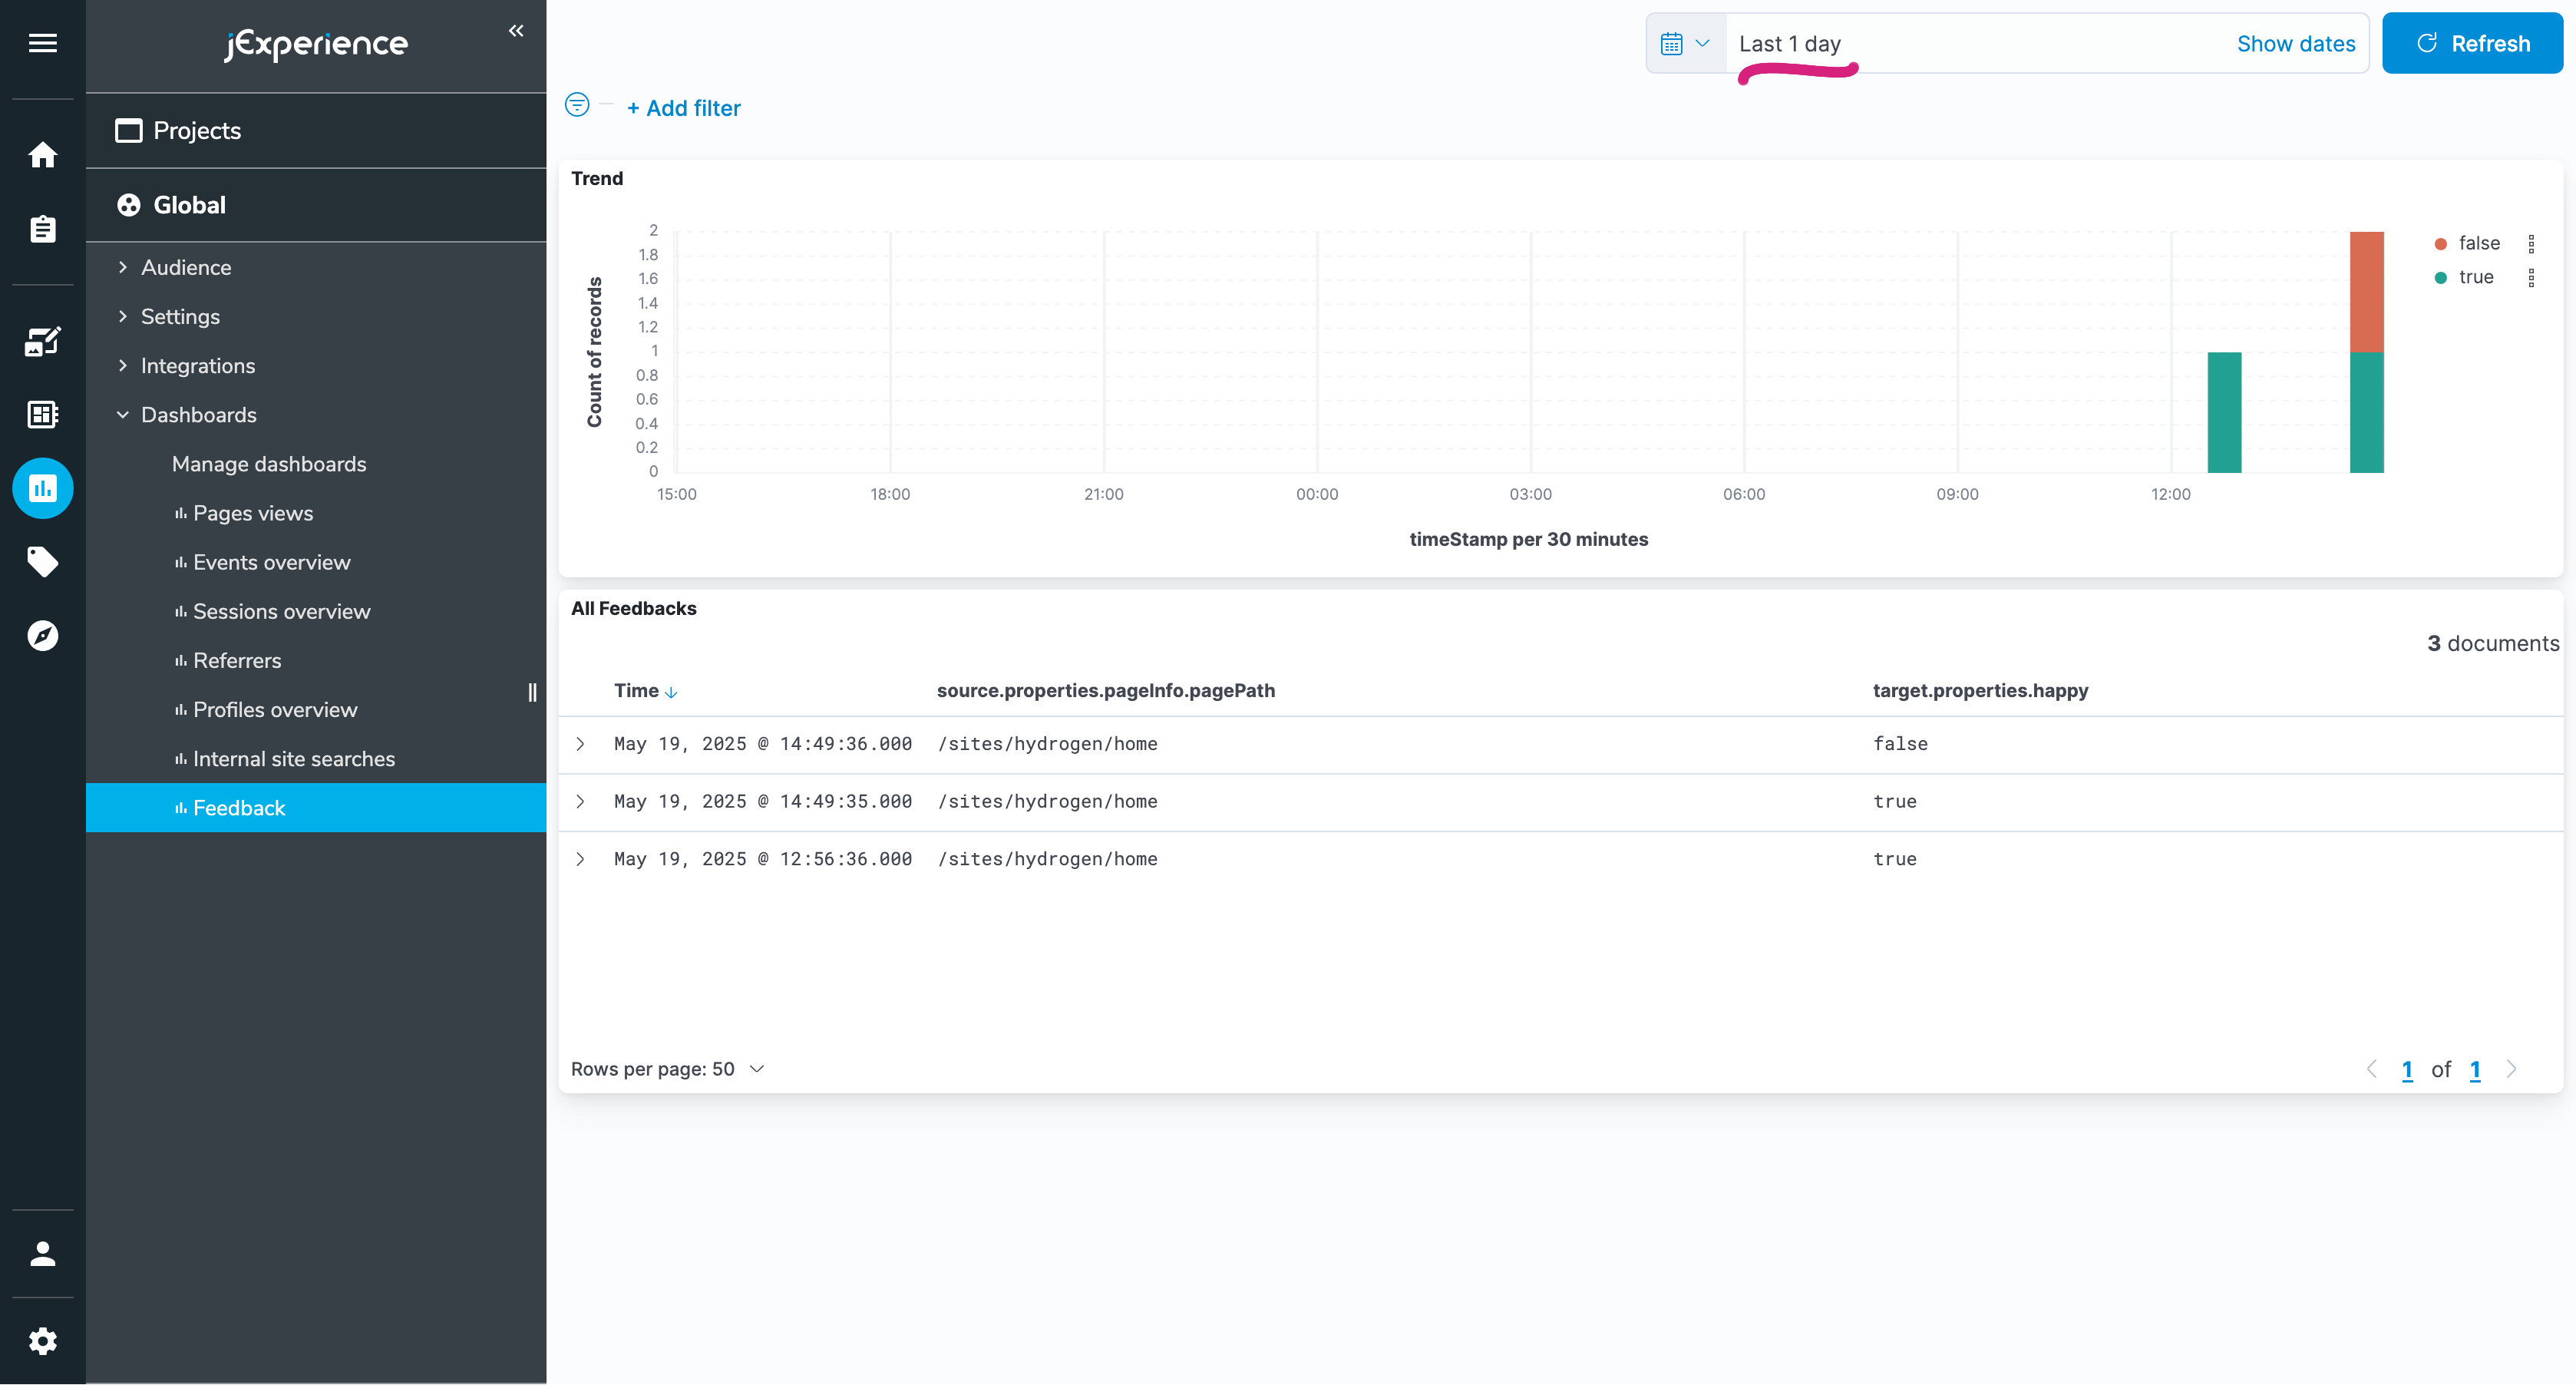
Refresh the page in Jahia to see your new dashboard listed in the jExperience tab. Click on it to see the dashboard you just created. You can change the date range to see more or less data, and you can also use the Refresh button to refresh the data in real time.
Packaging the Dashboard
Your dashboard currently exists only in your local instance of Jahia. In this section, we will package it inside your JavaScript Module so that it can be deployed to any Jahia instance.
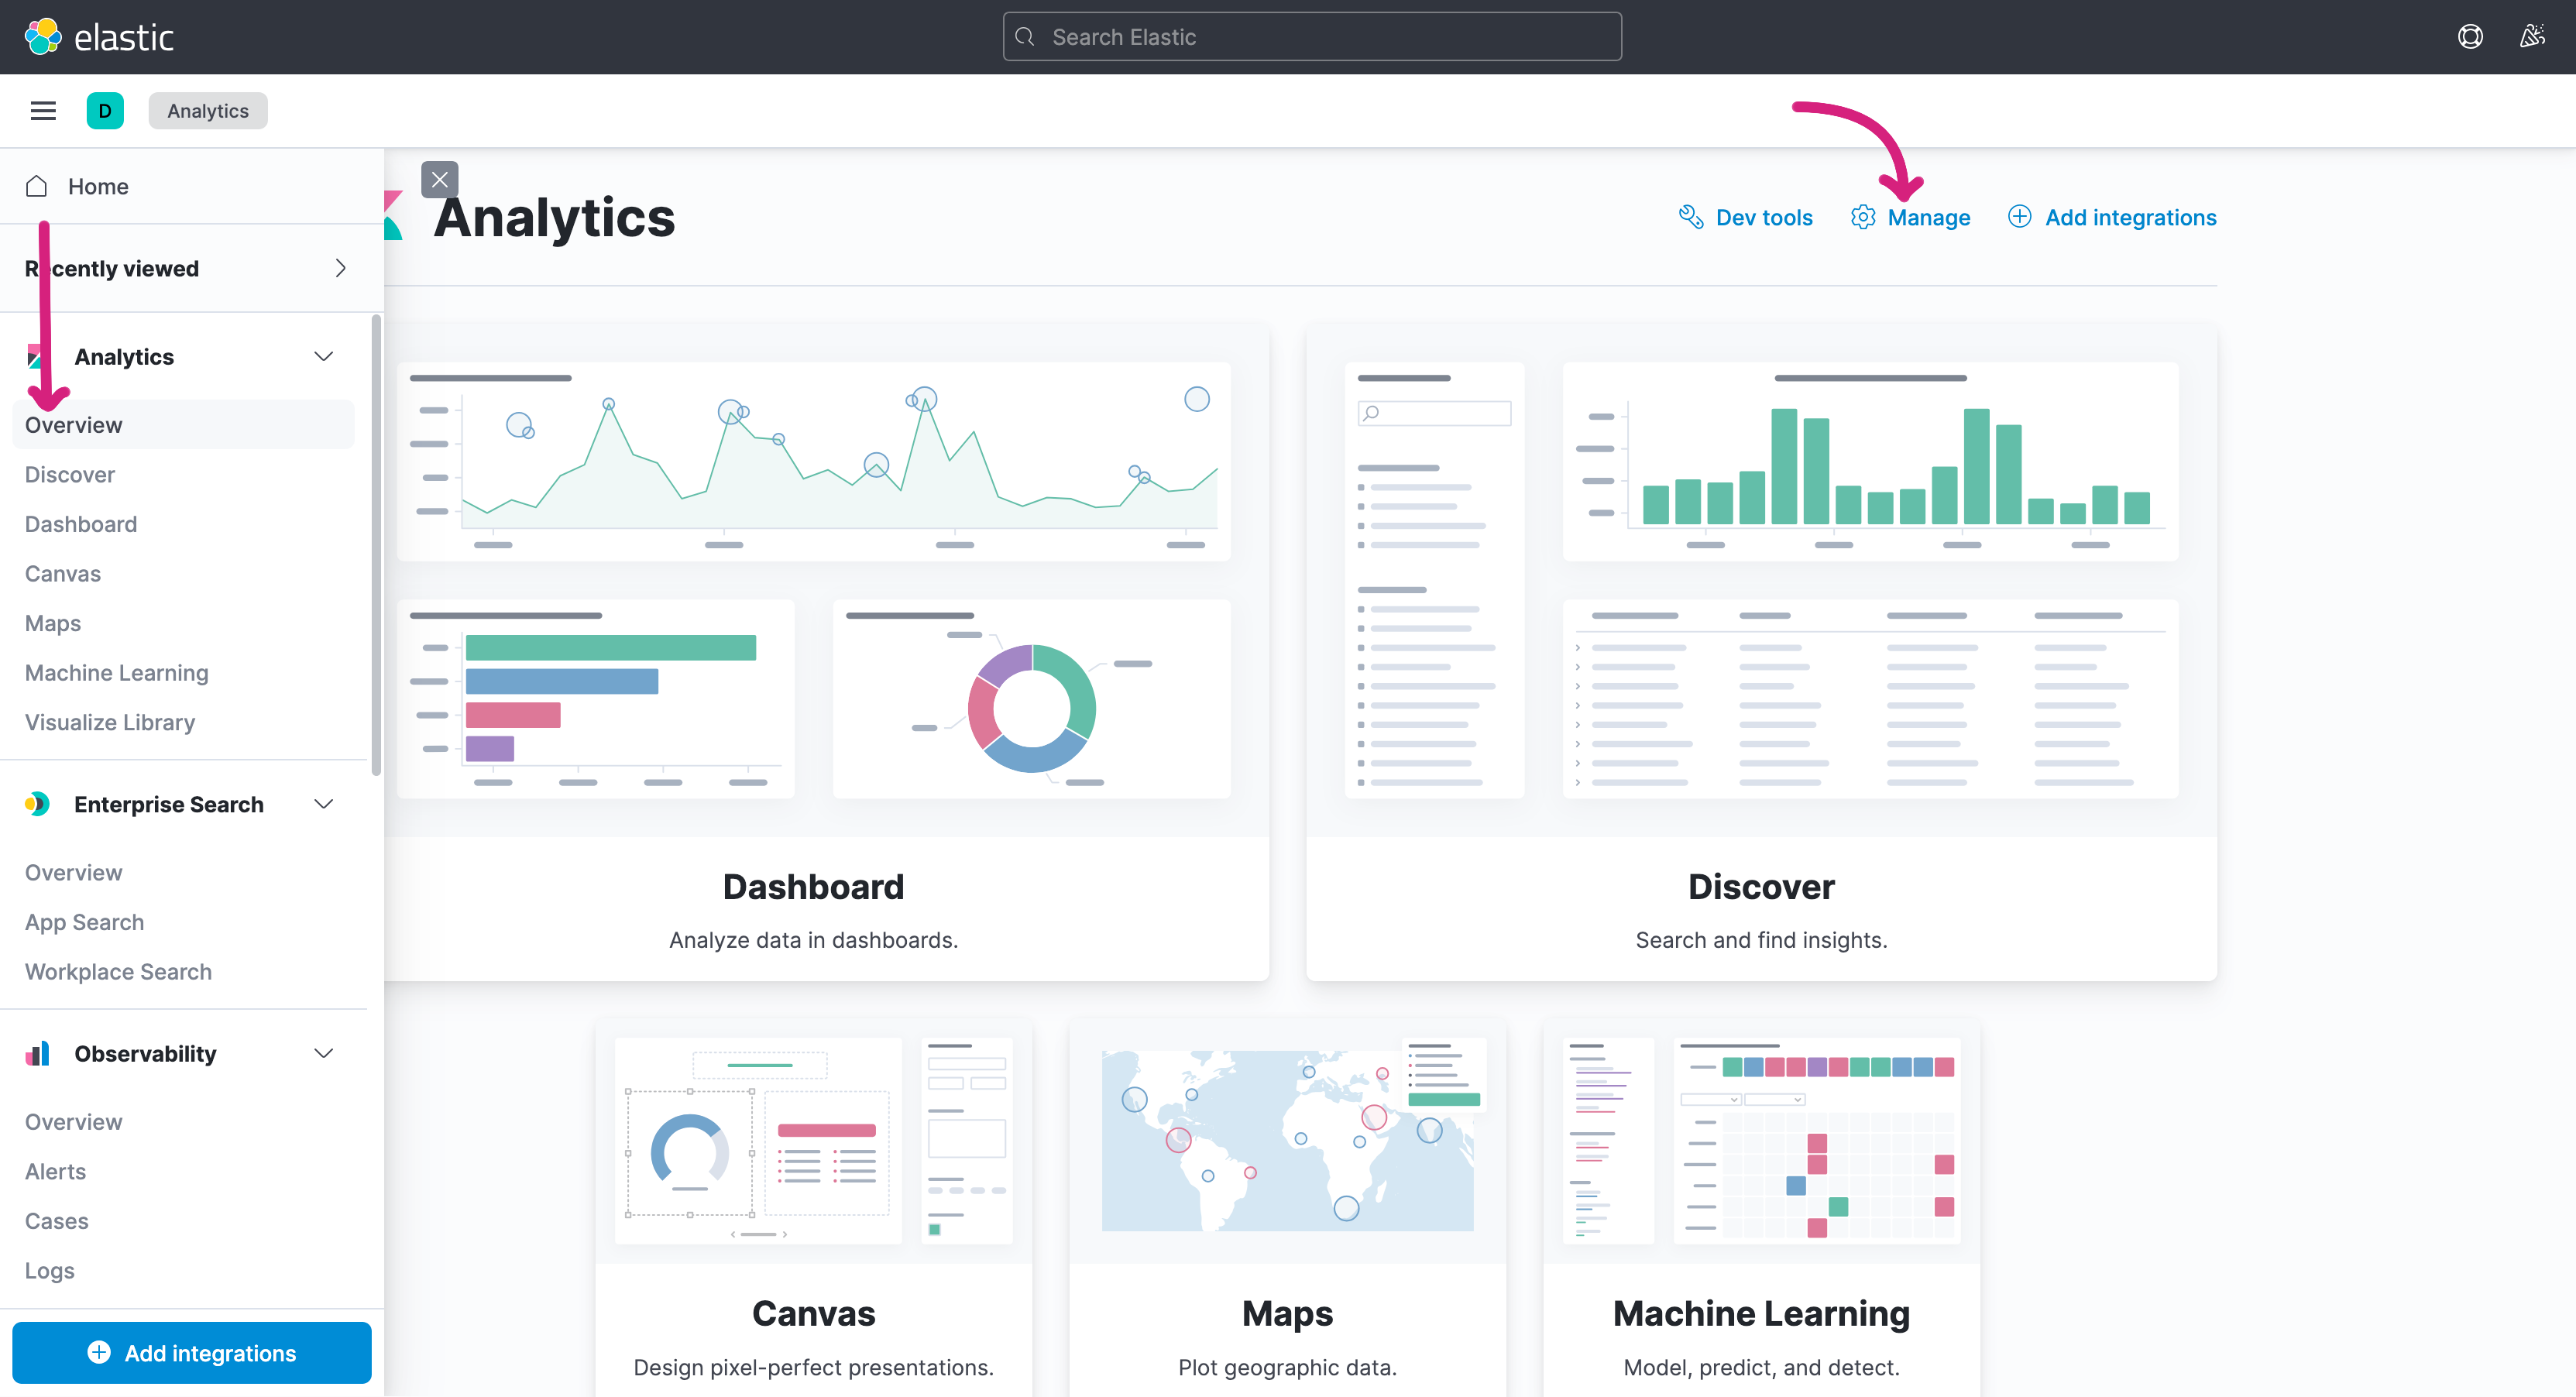
Open the management console of Kibana (Analytics > Overview > Manage):
In Saved Objects, select the dashboard you just created and click Export:
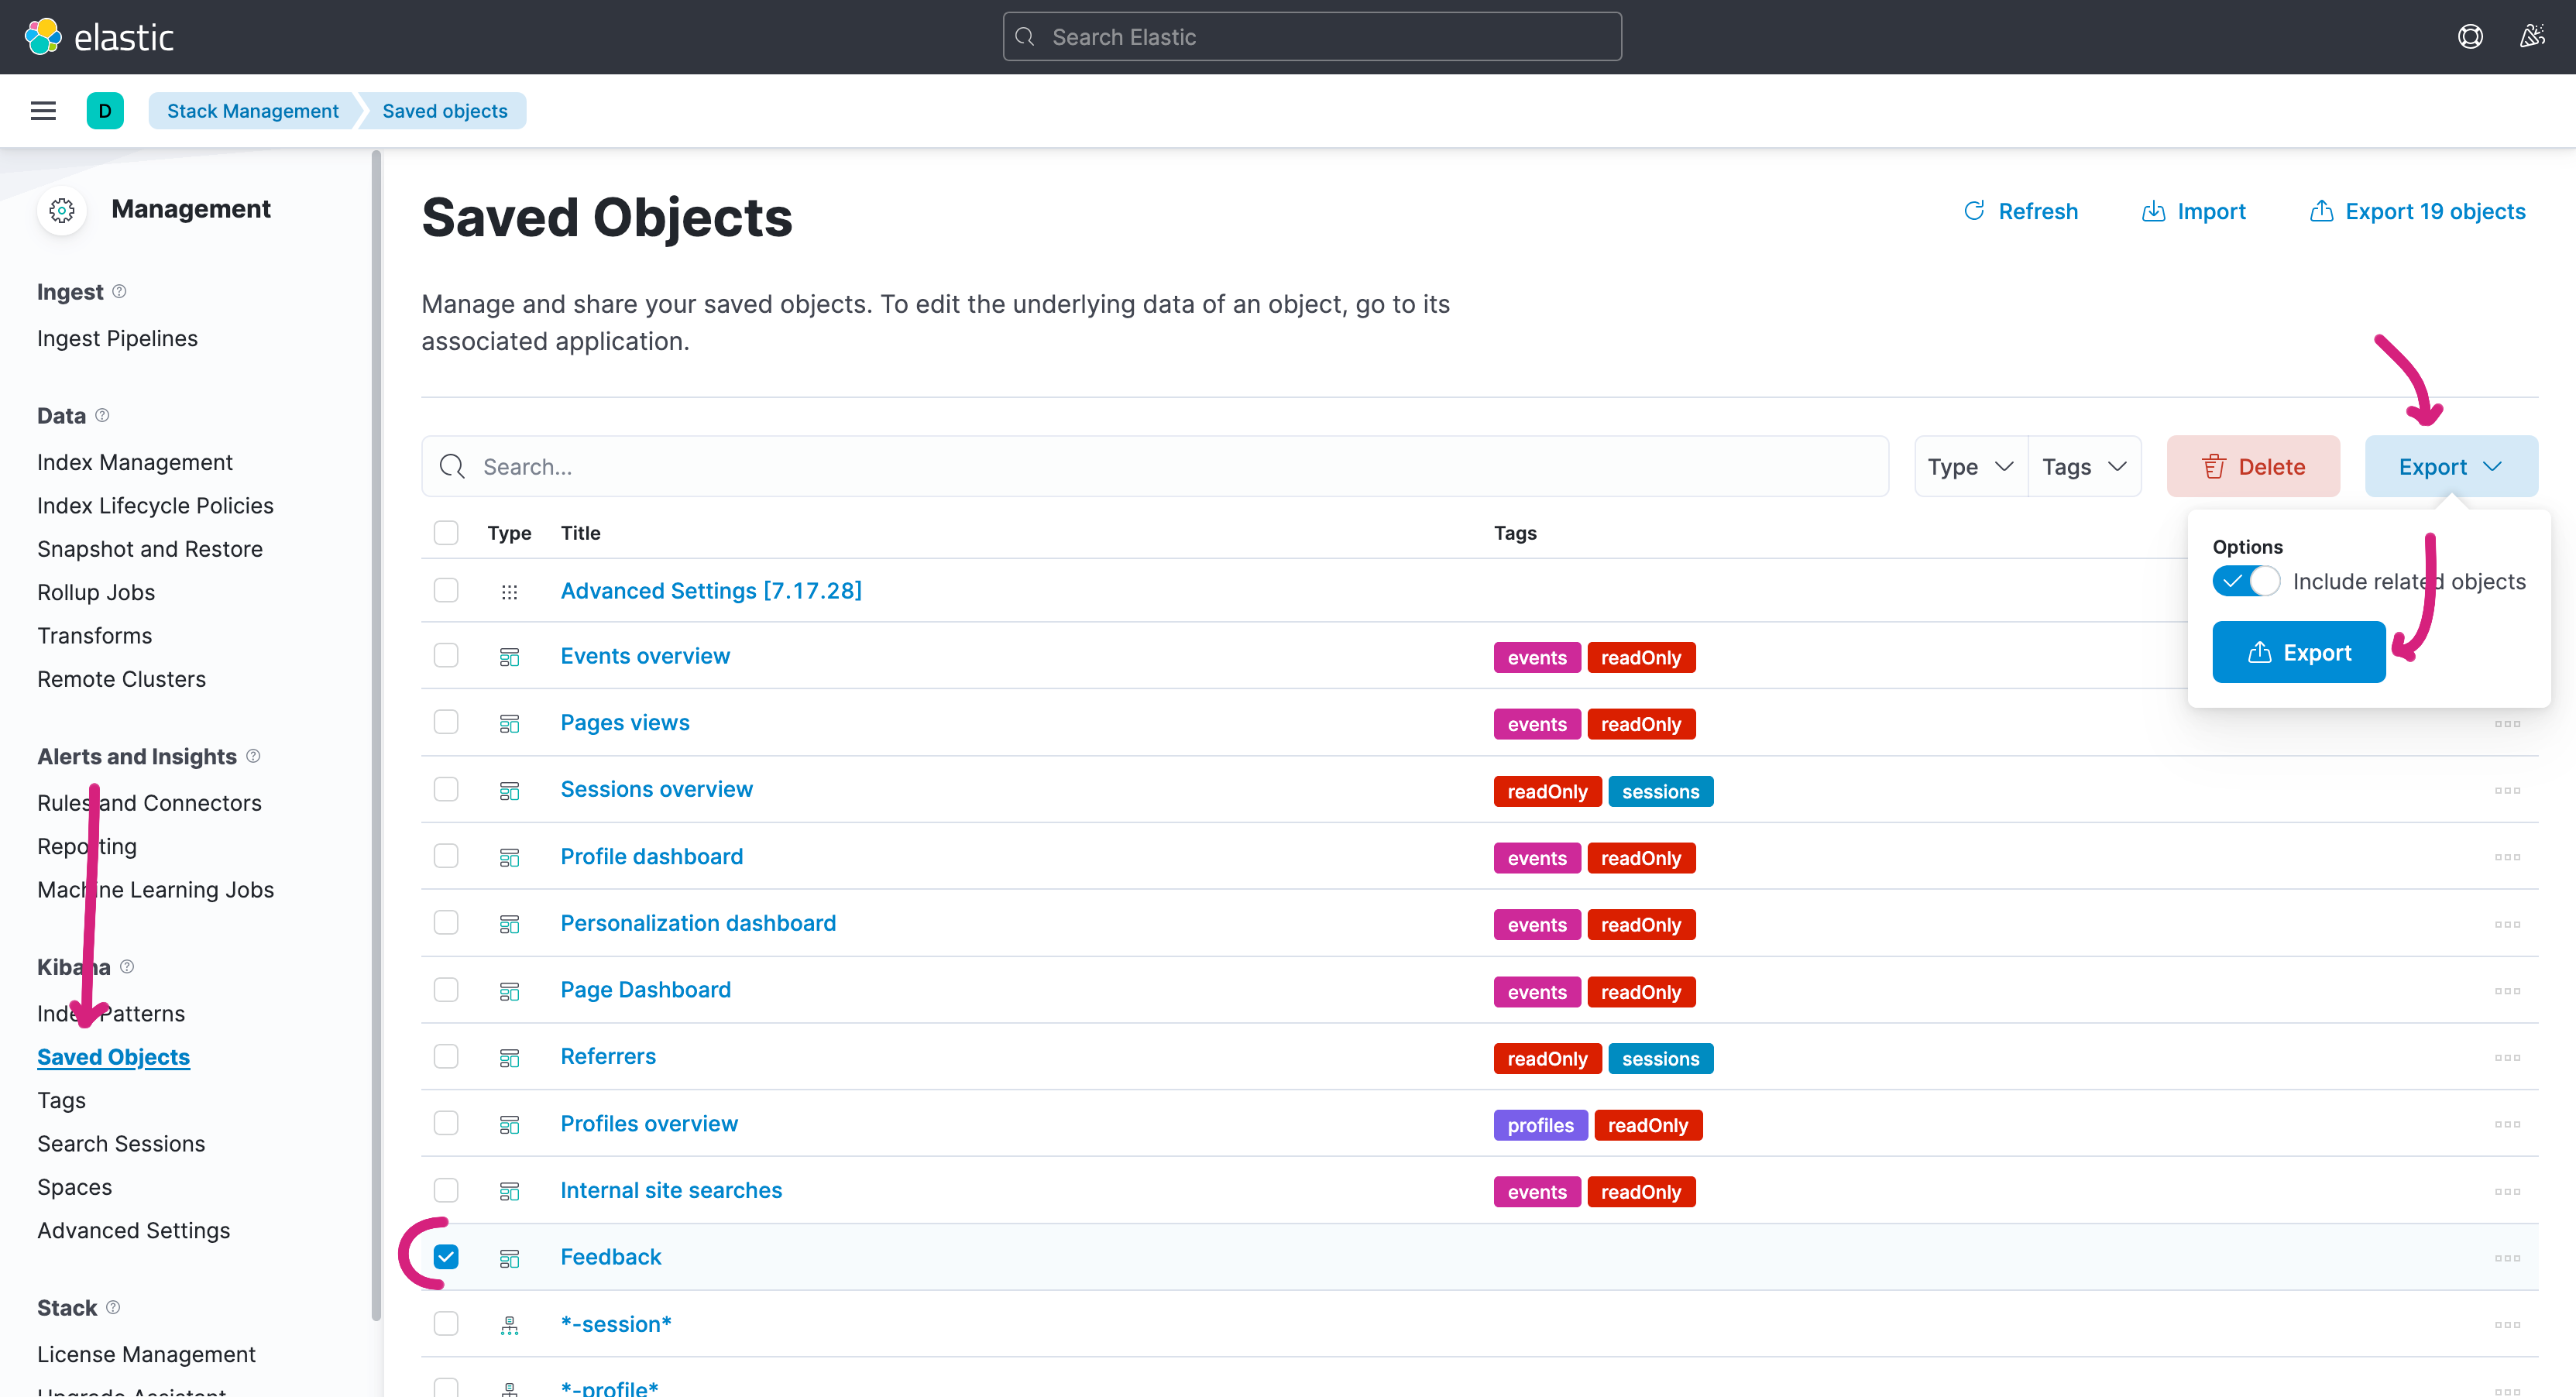
You will get a .ndjson file that contains the dashboard and all the visualizations you created. Save this file as settings/kibana-dashboard/dashboards/feedback.ndjson to include it in your module.
Now, when your module is deployed, the dashboard will be automatically imported into Jahia. You can check that it works by deploying your module to a new Jahia instance and checking that the dashboard is available in the jExperience tab.
This is it for this guide! We hope you enjoyed it and found it useful. If you have any questions or feedback, please let us know on GitHub.