Monitoring Jahia with the ELK Stack
INTRODUCTION
ELK stands for ElasticSearch, LogStash, and Kibana, which are 3 tools that, when used together, allow to monitor an architecture, regardless of its size, by helping acquiring raw data, retrieving the important parts, indexing, querying and finally presenting them in charts and in beautiful dashboard representations.
This document is intended to share feedback on a first experience with the ELK stack and to demonstrate to a technical audience (e.g DevOps professionals) how such tools work and can help better monitor Jahia-based infrastructures.
At the end, the reader should be able to setup a basic ELK stack, acquire the desired data (from logs or system metrics), present these information thanks to Visualizations (Kibana’s vocabulary corresponding to a chart), and regroup these Visualizations in Dashboards. Also, the reader should be able to carry out a simple export/import process on Visualizations and Dashboards to save their states and share them to another setup.
BASIC ELK ARCHITECTURE
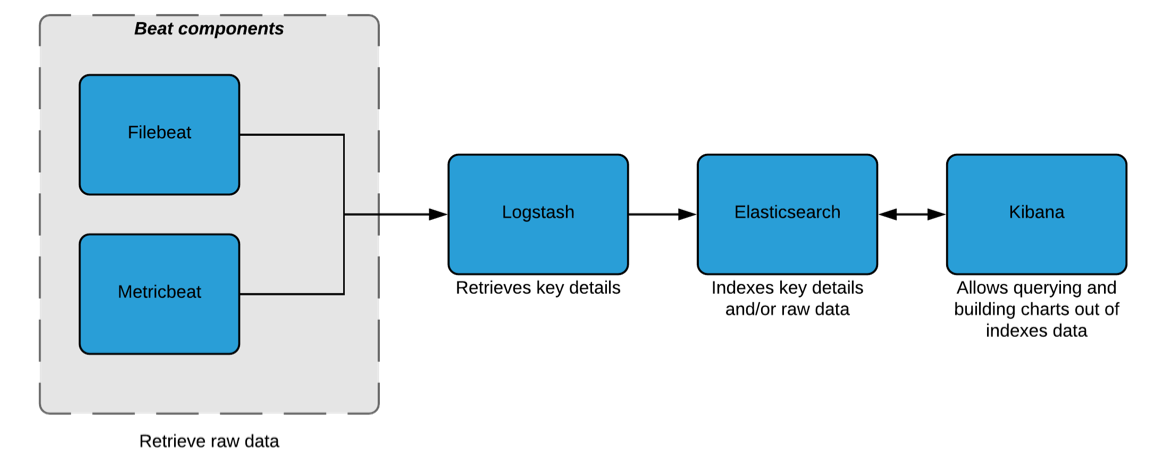
Figure 1 - Basic ELK setup
A basic ELK architecture (Cf. Figure 1) is made of:
- Beat components: these components are single-purpose data shippers, which means that each of them collects and gathers domain specific data and sends them either to Logstash or directly to Elasticsearch. In our case, they will send data to Logstash first for transformation and parsing prior to being indexed in Elasticsearch.
- Logstash: in charge of retrieving the important parts from the raw data it receives and of enriching them. This process is done through a filter based pipeline that would have to be configured (Cf. Figure 2)
- ElasticSearch: receives the parsed data fields and/or raw data and indexes them
- Kibana: allows querying data indexed in ElasticSearch, but more importantly, enables user to build charts out of indexed data.
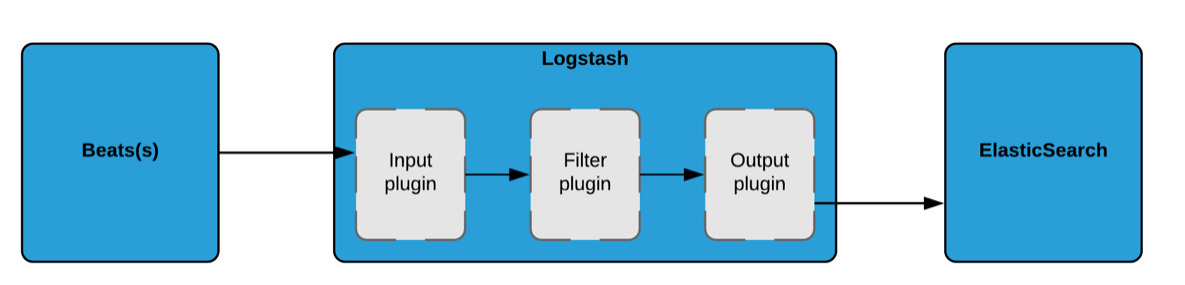
Figure 2 - Logstash data acquisition pipeline
This data acquisition - visualization process is streamlined thanks to the ELK stack, however each functional block still needs to be configured. Logstash is the functional block that will require the most effort to configure as it is central to the data acquisition process. In the following sections, we will see how to setup these functional blocks for the whole architecture to work smoothly.
The way beats work and communicate event data to logstash is out of the document’s scope, but further details can be found here.
Also, please note that the architecture described here is a basic architecture that will help us follow and analyze concrete real-world examples but, if needed, it can be enhanced by adding other beat components (e.g Packetbeat, Topbeat etc.).
SETUP
In this part, we will explain how to setup the basic stack described in Part 2 on your local machine. It makes no doubt that the settings provided are for training purposes and therefore more fine-tuning is required if the aim is to later go into production.
Please note that in this section, we will refer to $install_stack_path when the stack’s installation path is required. You remain free to choose the installation path that suits you best.
Also, it will be taken as granted that you use JDK 8 and that you use a Linux-like system. For other OSes the official installation links we provided should assist you in this installation process.
ELASTICSEARCH
Official installation link: https://www.elastic.co/guide/en/elasticsearch/reference/current/_installation.html
- Download the package required for your OS
- Extract the downloaded package to
/$install_stack_path/Elasticsearch/ - Follow the tutorial (Cf. link above) and input the $install_stack_path installation path. Stop following the tutorial when it asks to start Elasticsearch. Indeed, it needs further configuration before being started.
- Set the node name as well as the cluster name. To do so, edit the following file
/$install_stack_path/config/elasticsearch.ymland put “my_cluster” as value of the “cluster.name” key and “node_1” for the “node.name” key.
Except this custom configuration, the default settings are kept. It means that Elasticsearch will provide access to its REST API on localhost on port 9200.
It should be noted that in case the installation of Elasticsearch is spread across several servers, it is necessary to bind the configuration on the local network interface, and stop listening to incoming network traffic on 127.0.0.1 (this is a common mistake).
Once done, you can start Elasticsearch by executing the following command:
/$install_stack_path/bin/elasticsearch
You can test if it properly launches by reaching http://localhost:9200/ and checking if you receive such response:
{
  "name" : "node_1",
  "cluster_name" : "my_cluster",
  "cluster_uuid" : "NOrj73o0SRSkOFyGqQregQ",
  "version" : {
    "number" : "6.1.1",
    "build_hash" : "bd92e7f",
    "build_date" : "2017-12-17T20:23:25.338Z",
    "build_snapshot" : false,
    "lucene_version" : "7.1.0",
    "minimum_wire_compatibility_version" : "5.6.0",
    "minimum_index_compatibility_version" : "5.0.0"
  },
  "tagline" : "You Know, for Search"
}
If the name (name of the node) and cluster_name match the settings you just made, the installation went well.
LOGSTASH
Official installation link: https://www.elastic.co/guide/en/logstash/current/installing-logstash.html
- Download the package required for your OS
- Extract the downloaded package to
/$install_stack_path/Logstash/
The default host and port settings are kept, which means that it will be reachable at localhost. The open ports will depend on the inputs that will be configured (Cf. below).
In our case, we will set the input to beats on port 5044 (to receive data from Metricbeat for instance) and the output to Elasticsearch (localhost:9200 as set before). To do so, create a new file called “my-first-conf.conf” in /$install_stack_path/Logstash/config/ and set the following content:
input {
    beats {
        port => "5044"
    }
}

output {
    elasticsearch {
     hosts => [ "localhost:9200" ]
     index => "metricbeat-%{+YYYY.MM.dd}"
    }
}
Please note that the optional filter entry is not set at this point, as it entirely depends on the use cases. This way, the custom filter configurations will be provided when discussing the real-world examples (Cf. Part 4).
- In order to test the installation and the default configuration, we will stash our first event. To do so, please launch Logstash by executing this command:
/$install_stack_path/Logstash/bin/logstash -e 'input { stdin { } } output { stdout {} }'
This will take the stdin stream as input and output it to the stdout stream. Therefore, if you input “Hello world” once Logstash is launched, it should output “Hello world” in the console. If this is the case, Logstash is properly installed.
- If the test passed, then Logstash can be launched with the “my-first-conf.conf” configuration we just set. To do so execute the following command:
/$install_stack_path/Logstash/bin/logstash -f ./config/my-first-conf.conf --config.reload.automatic
METRICBEAT (AS FIRST BEAT COMPONENT)
Official installation link: https://www.elastic.co/guide/en/beats/metricbeat/current/metricbeat-installation.html
- Download the package required for your OS
- Extract the downloaded package to /$install_stack_path/Metricbeat/
By default, Metricbeat collects metrics on the CPU, filesystem, memory, network process etc. We will not tweak this part but only change the Metricbeat network output. To do so, edit the following file /$install_stack_path/Metricbeat/metricbeat.yml and:
- Comment the lines where
output.elasticsearch:andhosts: ["localhost:9200"]are mentioned as in our case we don’t want to directly output data to Elasticsearch. - Comment out the lines where
output.logstash:andhosts: ["localhost:5044"]are mentioned, as we want to output data to Logstash.
Once done, Metricbeat can be started by executing the following commands:
sudo chown root /$install_stack_path/Metricbeat/metricbeat.yml

sudo chown root /$install_stack_path/Metricbeat/modules.d/system.yml

sudo /$install_stack_path/Metricbeat/metricbeat -e -c /$install_stack_path/Metricbeat/metricbeat.yml
The first 2 commands are just needed the first time it is launched. The 3rd command helps defining the Metricbeat’s configuration thanks to the “-c” argument.
For further details, on how Metricbeat internally works please refer to the following link: https://www.elastic.co/guide/en/beats/metricbeat/current/how-metricbeat-works.html
KIBANA
Official installation link: https://www.elastic.co/guide/en/kibana/current/targz.html
- Download the package required for your OS
- Extract the downloaded package to
$install_stack_path/Kibana/ - Set the URL of the Elasticsearch instance. To do so, comment out the following line:
elasticsearch.url: "http://localhost:9200"
- Start the Kibana instance by executing the following command:
/$install_stack_path/Kibana/bin/kibana
Once these steps followed the ELK stack should be all set.
TEST THE WHOLE STACK SETUP
Each functional blocks are already independently tested but the the ELK stack, as a whole, remains to be tested. In our case, if well configured, the data should be sent from Metricbeat, to Elasticsearch and being visible in Kibana. As a test:
- First we will install the pre-built Metricbeat’s Dashboards. To install those dashboards, please execute the following command:
/$install_stack_path/Metricbeat/metricbeat setup --dashboards
Later, when it comes to real-world examples (Cf. Part 4), we will see how to build dashboards from scratch.
Once done please:
- Access Kibana through this link: http://localhost:5601/
- Go to the “Discover” tab and click on the Metricbeat index pattern (“metricbeat-*”)
- You should be able to see the data sent by Metricbeat (Cf. Figure 3)
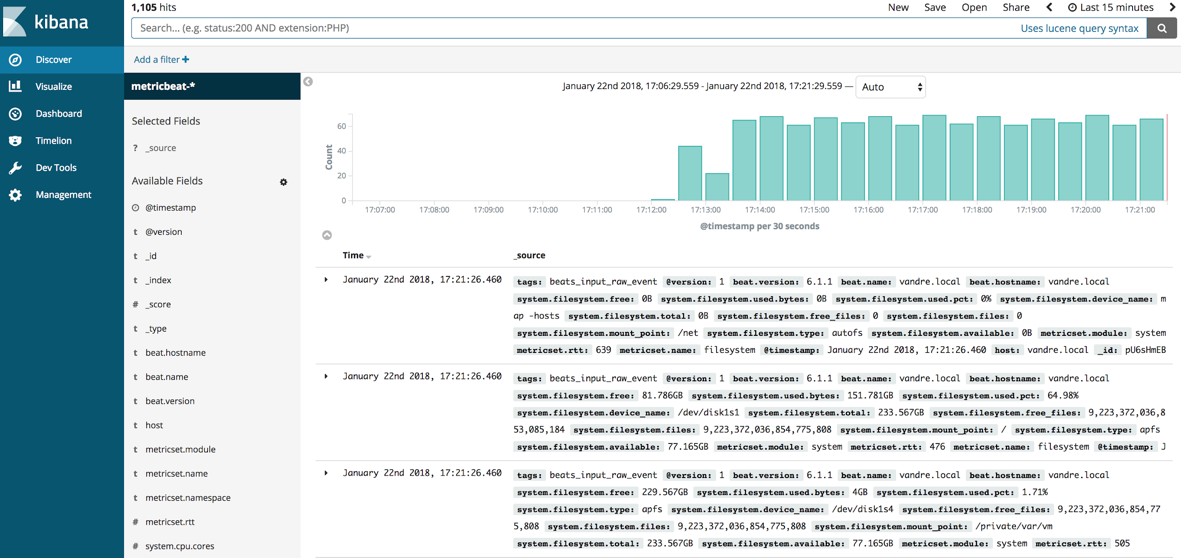
Figure 3 - Metricbeat indexed data
If this is not the case, at the top right corner, please increase the time window in Kibana (by default last 15 minutes).
If you passed the first test, we can now check if these data can be represented thanks to the pre-built Visualizations and Dashboards. To do so:
- Go to the “Dashboard” tab
- Select the Dashboard named “[Metricbeat System] Host overview”
- The resulting dashboard should look like the one presented in Figure 4.
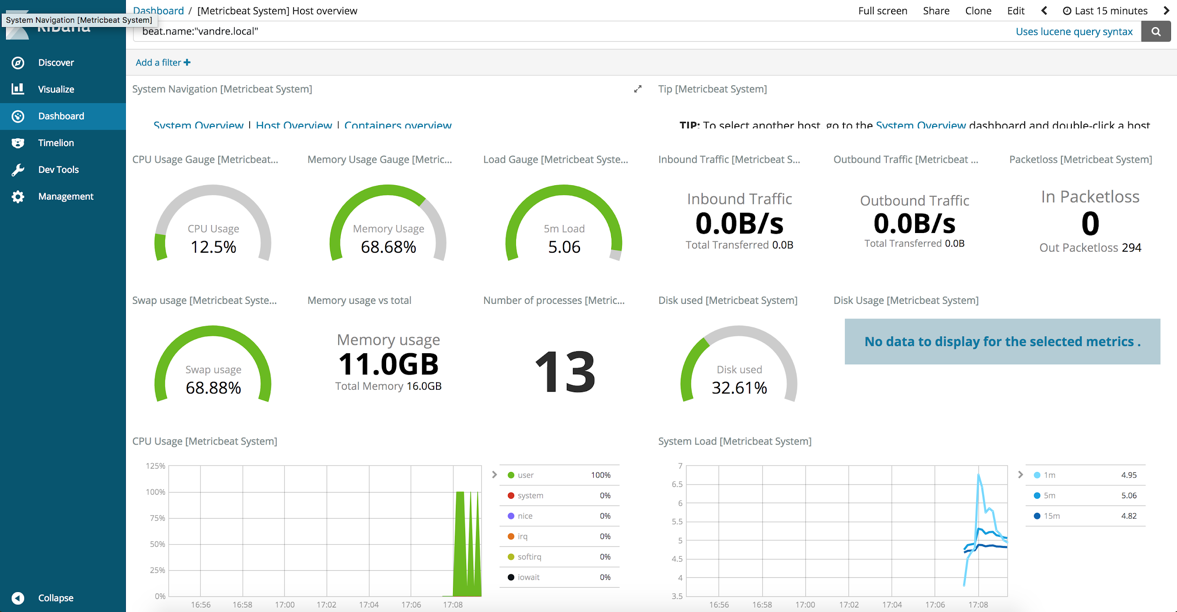
Figure 4 - [Metricbeat System] Host overview pre-built dashboard
JAHIA SPECIFIC METRICS
PRELIMINARY CONFIGURATION
Logstash configuration
In all use cases, we will index the retrieved data to the logstash-* indexes. This way, the Logstash configuration should be changed from
output {
    elasticsearch {
     hosts => [ "localhost:9200" ]
     index => "metricbeat-%{+YYYY.MM.dd}"
    }
}
to
output {
    elasticsearch {
     hosts => [ "localhost:9200" ]
    }
}
Following this change, please create the Logstash’s index pattern in Kibana. To do so:
- Access Kibana through this link: http://localhost:5601/
- Go to the “Management” tab and click on “Index Patterns”
- Click on “Create Index Pattern”
- Specify the following index pattern value: logstash-* corresponding to the Logstash’s index pattern and then click on “Next step”
- Select the “@timestamp” as “Time filter field name” and click on “Create Index Pattern”
Filebeat configuration
Since we now want to retrieve information from a log file, the beat component should be changed from Metricbeat to Filebeat.
To install Filebeat please refer to the following link: https://www.elastic.co/guide/en/beats/filebeat/current/filebeat-installation.html
but keep in your mind that it should be installed under the following folder: /$install_stack_path/Filebeat/
This new Beat component should be configured to take the Tomcat’s “catalina.out” log file as input and output the read data to Logstash. Therefore the Filebeat configuration, located at /$install_stack_path/Filebeat/config/filebeat.yml, should be set as follows:
filebeat.prospectors:
- type: log
  paths:
    - $catalina_log_file_path

output.logstash:
  hosts: ["localhost:5044"]
where $catalina_log_file_path is the absolute path to the catalina.out log file.
Please note that Filebeat prospectors look for data sources and launch one harvester for each found data sources set. Harvesters, for their part, are responsible for reading each data source and sends the content, through event data, to the set output (Logstash in our case).
RETRIEVE THE JCR SESSION LOAD FROM THE LOGS
The JCR Session Load indicates the average number of JCR Sessions opened at this time. JCR Sessions are used to interact with the content of the CMS and are closed once the user request is completed. When during the last minute the average is > 10, the JCR Session Load average is output to the logs following this format:
2017-11-13 16:52:47,913: INFO [JCRSessionLoadAverage] - Jahia JCR Session Load = 10.073724622596092 5.126806713151794 3.0415065607324436
First figure is the average value during the past minute, second value during past five minutes, third value during past fifteen minutes.
We will retrieve the JCR Session Load average per minute.
Logstash configuration
Here is the Logstash configuration that allows retrieving the JCR Session Load average per minute:
input {
    beats {
        port => "5044"
    }
}
filter {
  if "[JCRSessionLoadAverage]" in [message] {
    grok {
      match => ["message", "(?<timestamp_log>%{TIMESTAMP_ISO8601}): %{LOGLEVEL:loglevel} * \[(?<logger>[A-Za-z0-9$_.]+)\] - [a-zA-Z ]+ = %{NUMBER:1min_jcrLoad:float}%{SPACE}%{NUMBER:5min_jcrLoad:float}%{SPACE}%{NUMBER:15min_jcrLoad:float}$"]
    }
  }
  date {
      match => [ "timestamp_log", "YYYY-MM-dd HH:mm:ss,SSS" ]
      target => "@timestamp"
  }
}
output {
    elasticsearch {
      hosts => [ "localhost:9200" ]
    }
}
Input and output configurations are the same as before (Cf. Part 3.2). Only the Logstash filter’s configuration is added.
To configure the Logstash filter, we use the grok plugin that helps parsing arbitrary text and structure it into named fields. For instance, the following configuration of the filter:
if "[JCRSessionLoadAverage]" in [message] {
    grok {
      match => ["message", "(?<timestamp_log>%{TIMESTAMP_ISO8601}): %{LOGLEVEL:loglevel} * \[(?<logger>[A-Za-z0-9$_.]+)\] - [a-zA-Z ]+ = %{NUMBER:1min_jcrLoad:float}%{SPACE}%{NUMBER:5min_jcrLoad:float}%{SPACE}%{NUMBER:15min_jcrLoad:float}$"]
    }
    date {
      match => [ "timestamp_log", "YYYY-MM-dd HH:mm:ss,SSS" ]
      target => "@timestamp"
    }
  }
will tell Logstash that each time it receives data matching the following regex:
(?<timestamp_log>%{TIMESTAMP_ISO8601}): %{LOGLEVEL:loglevel} * \[(?<logger>[A-Za-z0-9$_.]+)\] - [a-zA-Z ]+ = %{NUMBER:1min_jcrLoad:float}%{SPACE}%{NUMBER:5min_jcrLoad:float}%{SPACE}%{NUMBER:15min_jcrLoad:float}$
where TIMESTAMP_ISO8601, LOGLEVEL, NUMBER, SPACE are pre-defined grok regex patterns, it should put the timestamp into a “timestamp_log” field, the log level in a “loglevel” field, and the averages of JCR Session Load (1min, 5min, and 15min), respectively in “1min_jcrLoad”, “5min_jcrLoad”, “15min_jcrLoad” fields.
This Grok regex format is a bit complexified to indicate to Grok which element should be parsed and put into fields.
By default, Logstash retrieves and outputs fields as Strings to Elasticsearch. Since, some computations might be needed (aggregation etc.) on the JCR Session Load fields, we convert them into numbers thanks to the “:number” syntax.
Even if some data are formatted into fields, the whole data stream is kept into a “message” field.
By default, Logstash outputs data to Elasticsearch with a pre-defined “@timestamp” field that is set to the output time (the current time when Logstash parses the log file. As opposed to the time when the actual log was generated by the application). It can be useful when the timestamp value is not given in logs, but if it is, the “@timestamp” value is wrong and should be adjusted.
In our case, the timestamp is mentioned in the logs, so it is retrieved by the grok filter plugin, put into the “timestamp_log” field and then thanks to the date filter plugin the pre-defined “@timestamp” value is set to the “timestamp_log” value (Cf. code below). Thanks to this process, at the end, the “@timestamp” value is correct. In fact, it corresponds to the value mentioned in the logs.
date {
      match => [ "timestamp_log", "YYYY-MM-dd HH:mm:ss,SSS" ]
      target => "@timestamp"
}
Kibana visualization configuration
Browse collected and parsed data
No further configuration is needed to see in Kibana the collected and parsed data. To see these data you should go to the “Discover” tab and select the “logstash-*” index pattern.
Here below is an example of parsed JCR Session Load log message:
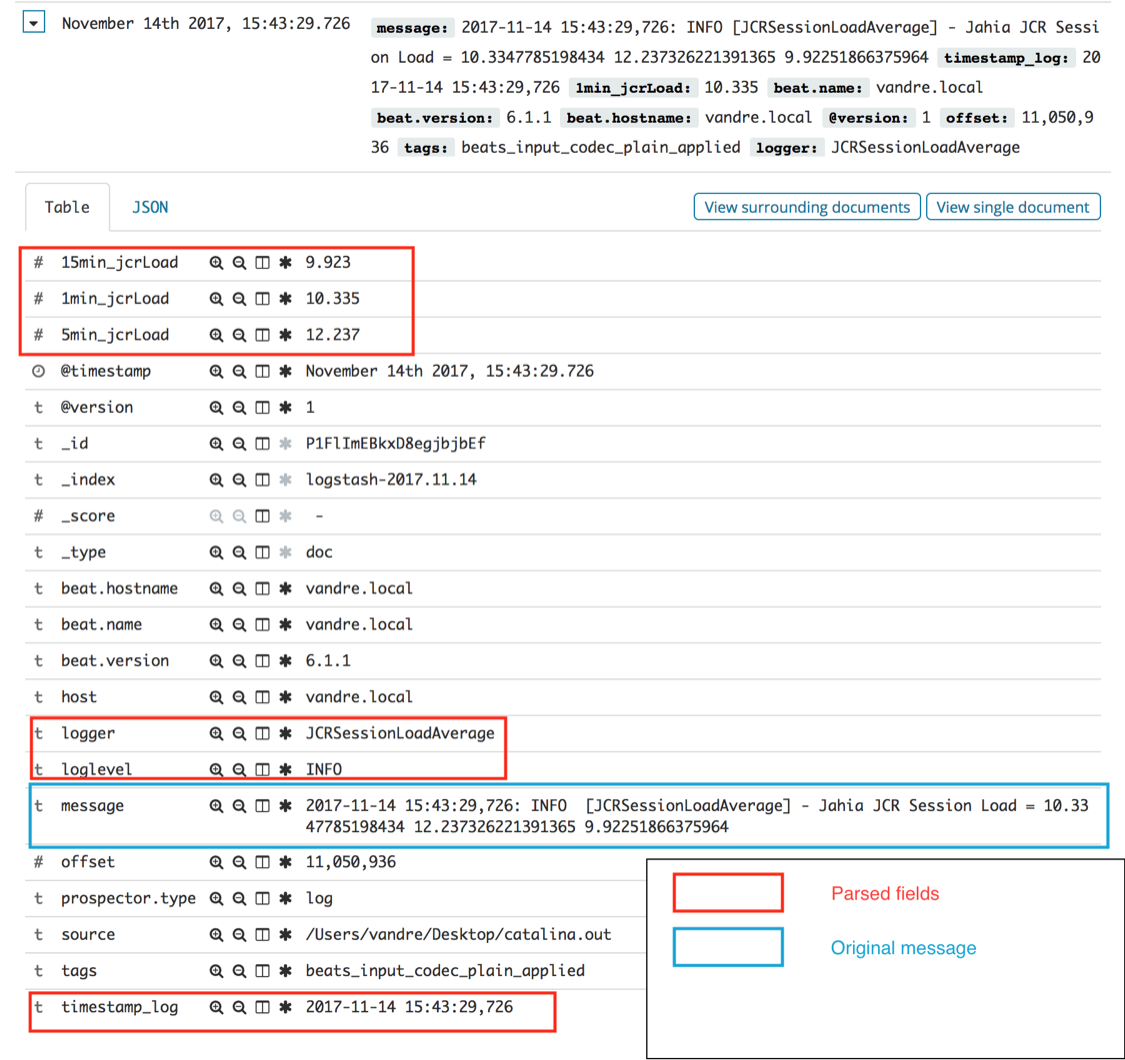
Figure 5 - Collected and parsed JCR Session Load average log message
From the screenshot given in Figure 5, you can see that, as expected, the “timestamp_log” field matches the pre-defined “@timestamp” field and that the “1min_jcrLoad”, “5min_jcrLoad”, “15min_jcrLoad” fields were actually converted into numbers (“#” symbol instead of “t”).
Build a Visualization
We will now build a Vertical bar visualization from to the JCR Session Load average data we just collected.
To do so:
- Access Kibana
- Click on the “Visualize” tab
- Click on the “+” button
- Click on the “Vertical Bar” button
- Click on the “logstash-*” index pattern
- Click on the arrow close the “Y-Axis” label
- Choose “Average” as aggregation mechanism and input the label you would like
- Choose “1min_jcrLoad” under the “Field” section
- Under the “Buckets” section, select the “X-Axis” button
- Choose “Date Histogram”as aggregation mechanism and “@timestamp” as the “Field”
- We advise you to keep the Interval to “Auto”
- Click on the “Play button” close to the “Panel settings” tab
Please find here below a screenshot of the settings we chose:
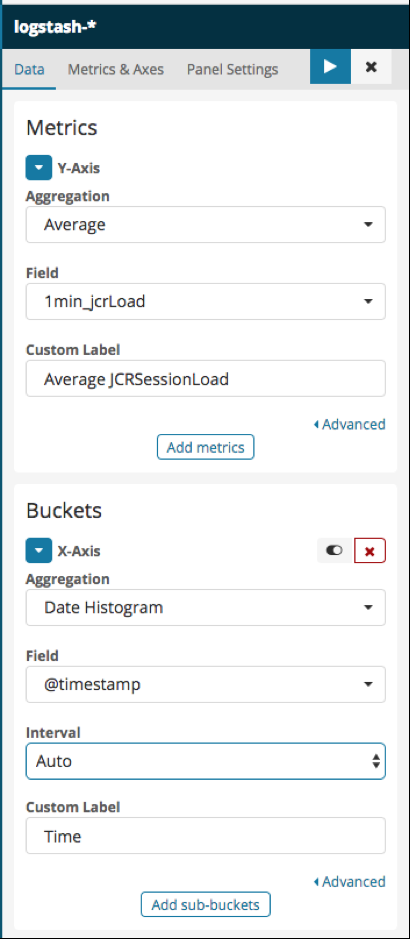
Figure 6 - The JCR Session Load average Vertical Bar Visualization’s settings
Now, the Visualization should be built and appear on the right. The rendering should look similar to this:
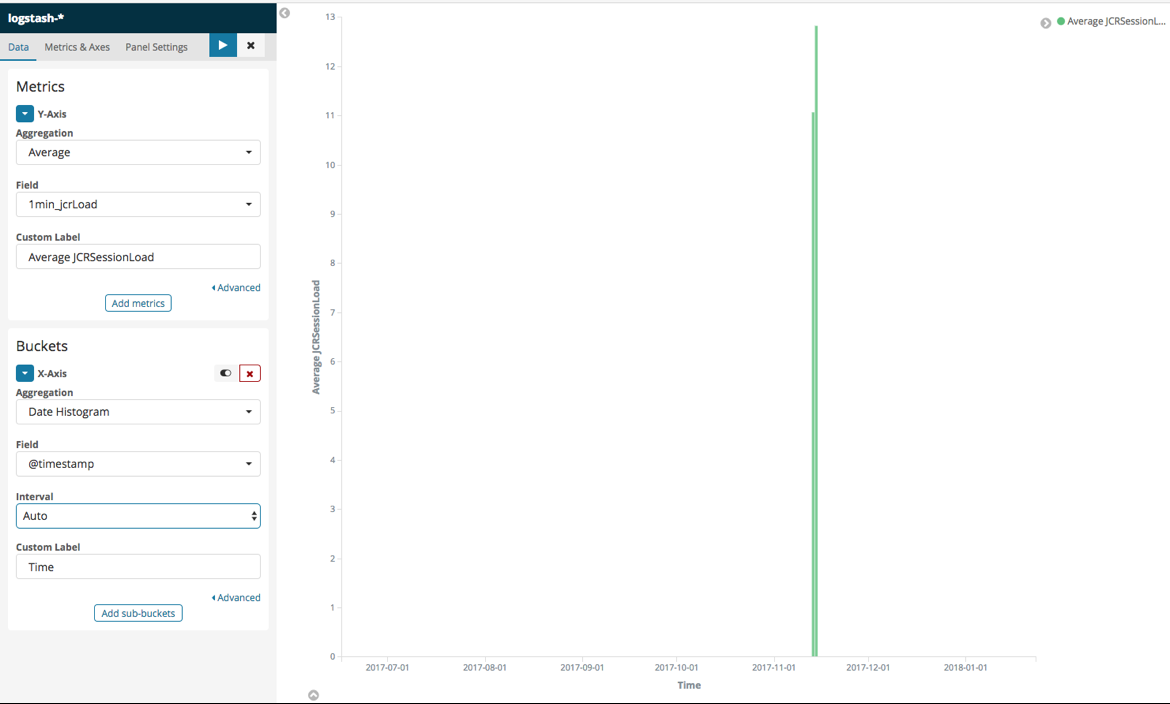
Figure 7 - The JCR Session Load average Vertical Bar Visualization
If this is not the case, at the top right corner, please increase the time window in Kibana (by default last 15 minutes).
If the rendering suits you, save the visualization:
- Click on the “Save” button at the top of the window
- Input “[Jahia] Average JCRSessionLoad” as title and click “Save”
For further details on how to build custom Visualization, please refer to this link: https://www.elastic.co/guide/en/kibana/current/createvis.html
RETRIEVE THE JAHIA REQUEST LOAD FROM THE LOGS
Jahia Request Load indicates the average number of HTTP requests processed by the platform. A responsive platform usually processes its requests almost instantly and won’t accumulate backlog. A high value (>30) is usually a sign of an overloaded platform. Troubleshooting poor performances when the Jahia Request Load is too high can be done by analysing a thread dump generated when the Request Load was important. Should you have any questions regarding this topic, you Jahia support is able to assist.
When during the last minute the average is > 2, the Jahia Request Load average is output to the logs following this format:
2017-11-13 16:52:32,966: INFO [RequestLoadAverage] - Jahia Request Load = 6.708121276575991 2.591095909973447 1.042839487893612
First figure is the average value during the past minute, second value during past five minutes, third value during past fifteen minutes.
We will retrieve the Request Load average per minute. The way data will be collected, parsed and visualized will be similar to what was exposed in Part 4.2.
Logstash configuration
Here is the Logstash configuration that allows retrieving the Request Load average per minute:
input {
    beats {
        port => "5044"
    }
}
filter {
  if "[RequestLoadAverage]" in [message] {
    grok {
      match => ["message", "(?<timestamp_log>%{TIMESTAMP_ISO8601}): %{LOGLEVEL:loglevel} * \[(?<logger>[A-Za-z0-9$_.]+)\] - [a-zA-Z ]+ = %{NUMBER:1min_reqLoad:float}%{SPACE}%{NUMBER:5min_reqLoad:float}%{SPACE}%{NUMBER:15min_reqLoad:float}$"]
    }
  } else if "[JCRSessionLoadAverage]" in [message] {
    grok {
      match => ["message", "(?<timestamp_log>%{TIMESTAMP_ISO8601}): %{LOGLEVEL:loglevel} * \[(?<logger>[A-Za-z0-9$_.]+)\] - [a-zA-Z ]+ = %{NUMBER:1min_jcrLoad:float}%{SPACE}%{NUMBER:5min_jcrLoad:float}%{SPACE}%{NUMBER:15min_jcrLoad:float}$"]
    }
  }
  date {
      match => [ "timestamp_log", "YYYY-MM-dd HH:mm:ss,SSS" ]
      target => "@timestamp"
  }
}
output {
    elasticsearch {
      hosts => [ "localhost:9200" ]
    }
}
In addition to the Part 4.2’s configuration the green lines were added. The used Grok regex pattern is almost the same as the one exposed in 4.2 but the Request Load averages are put into new fields: 1min_reqLoad, 5min_reqLoad, 15min_reqLoad.
The explanations given in Part 4.2.1 remain appropriate to this configuration.
Kibana visualization configuration
Browse collected and parsed data
By setting up the configuration given in 4.3.1, it should collect data and parse the Request Load average values. Go to the “Discover” tab and select the “logstash-*” index pattern and you should see data as exposed below:
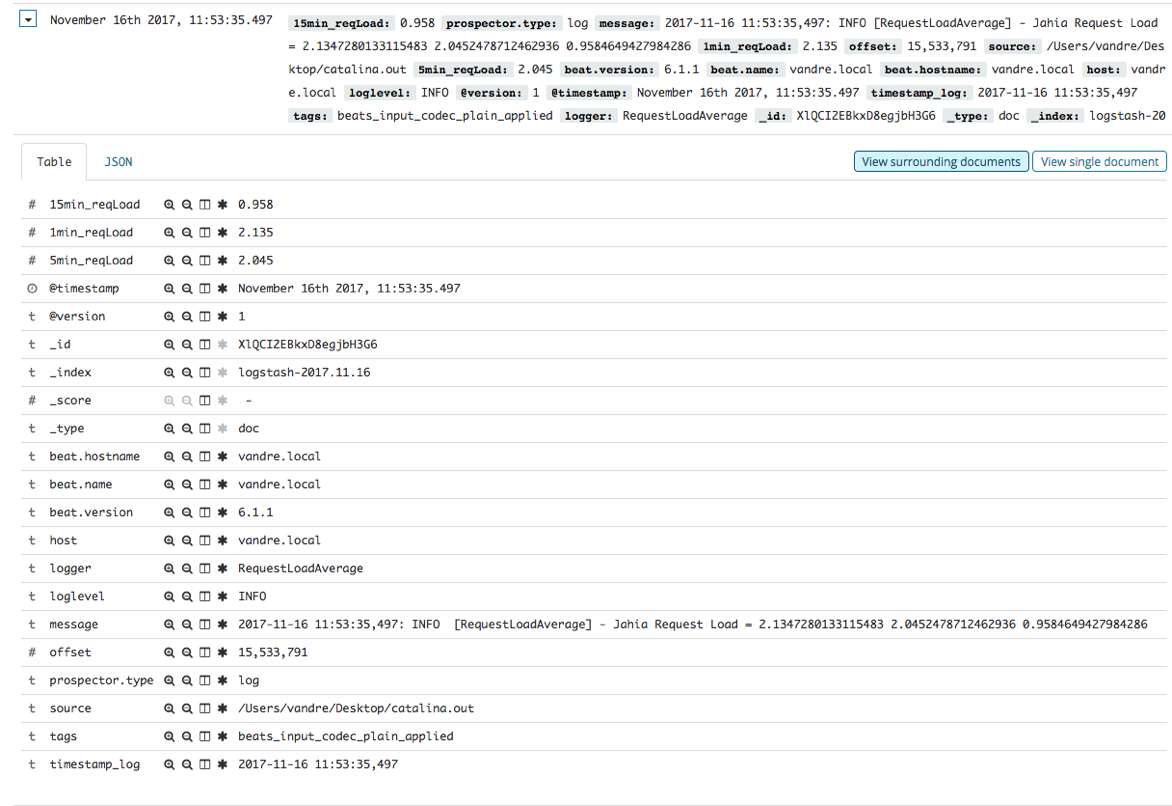
Figure 8 - Collected and parsed Request Load average log message
Build a Visualization
We will now build a Vertical bar visualization from the Request Load average data we just collected. To do so, follow the tutorial given in 4.2.2/Build Visualization, but replace “1min_jcrLoad” by “1min_reqLoad”.
Please find here below a screenshot of the settings we chose:
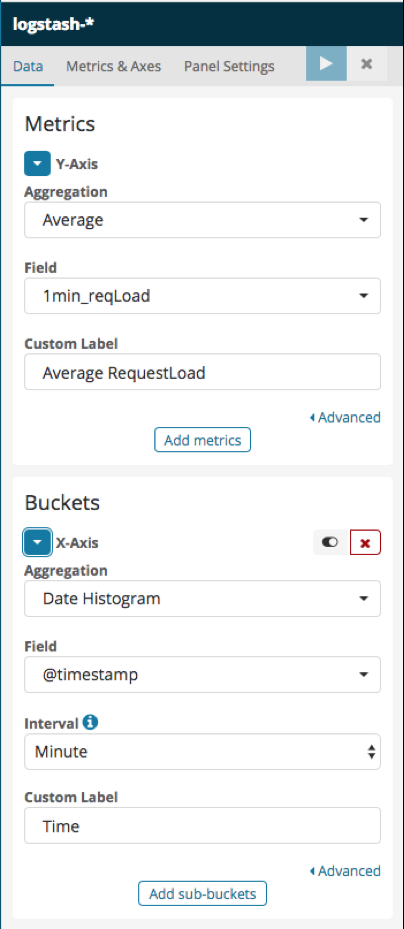
Figure 9 - The Request Load average Vertical Bar Visualization’s settings
Now, the Visualization should be built and appear on the right. It should look similar to this:
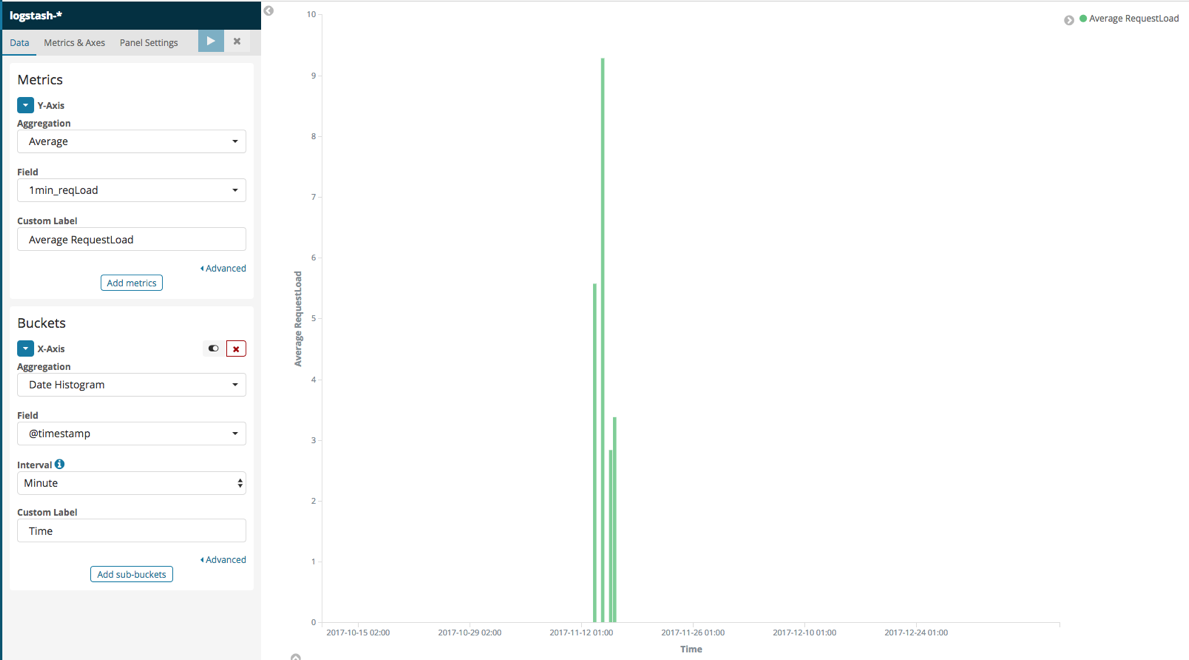
Figure 10 - The Request Load average Vertical Bar Visualization
If the rendering suits you, save the visualization:
- Click on the “Save” button at the top of the window
- Input “[Jahia] Average RequestLoad” as title and click on “Save”
RETRIEVE THE LOG LEVELS AND ERRORS’ STACK TRACES FROM THE LOGS
Logstash configuration
The previous use cases’ Logstash configurations were already allowing to retrieve the log levels, but it should work in all cases (not just for JCRSessionLoad and Request Load messages).
To handle the other cases, the Grok regex pattern displayed, below, in green was added to the configuration:
input {
    beats {
        port => "5044"
    }
}
filter {
  if "[RequestLoadAverage]" in [message] {
    grok {
      match => ["message", "(?<timestamp_log>%{TIMESTAMP_ISO8601}): %{LOGLEVEL:loglevel} * \[(?<logger>[A-Za-z0-9$_.]+)\] - [a-zA-Z ]+ = %{NUMBER:1min_reqLoad:float}%{SPACE}%{NUMBER:5min_reqLoad:float}%{SPACE}%{NUMBER:15min_reqLoad:float}$"]
    }
  } else if "[JCRSessionLoadAverage]" in [message] {
    grok {
      match => ["message", "(?<timestamp_log>%{TIMESTAMP_ISO8601}): %{LOGLEVEL:loglevel} * \[(?<logger>[A-Za-z0-9$_.]+)\] - [a-zA-Z ]+ = %{NUMBER:1min_jcrLoad:float}%{SPACE}%{NUMBER:5min_jcrLoad:float}%{SPACE}%{NUMBER:15min_jcrLoad:float}$"]
    }
  } else {
    # match the general Log4j appender format
    grok {
       match => [ "message", "(?<timestamp_log>%{TIMESTAMP_ISO8601}): %{LOGLEVEL:loglevel} * \[(?<logger>[A-Za-z0-9$_.]+)\] - %{GREEDYDATA}$" ]
    }
  }
  date {
      match => [ "timestamp_log", "YYYY-MM-dd HH:mm:ss,SSS" ]
      target => "@timestamp"
  }
}

output {
    elasticsearch {
      hosts => [ "localhost:9200" ]
    }
}
Most of the elements of the Grok regex pattern were already explained. Only the pre-defined GREEDYDATA element wasn’t. It is used to match the rest of the message.
With this new Logstash configuration, log levels should now be parsed in all cases.
Filebeat multiline handling
If we are done with the configuration related to the log levels, there is still some adjustments to make for the error stack traces to be retrieved entirely. Indeed, a stack trace takes several lines in the logs but until now just the first line of a stack trace could be retrieved.
This is due to the fact that, with the current settings, Filebeat sends data to Logstash line by line. In order, to retrieve the whole stack traces, please add the green lines, given below, to the Filebeat configuration file:
filebeat.prospectors:
- type: log
  paths:
    - $catalina_log_file_path
  multiline.pattern: ^[[0-9]{4}-[0-9]{2}-[0-9]{2}|^[\d]{2}-[a-zA-Z]{3}-[\d]{4}
  multiline.negate: true
  multiline.match: after

output.logstash:
  hosts: ["localhost:5044"]
where $catalina_log_file_path is the absolute path to the Tomcat’s “catalina.out” log file.
The multiline.pattern option allows Filebeat to pursue reading as long as it finds the specified pattern. Here the multiline.pattern was set to: ^[[0-9]{4}-[0-9]{2}-[0-9]{2}|^[\d]{2}-[a-zA-Z]{3}-[\d]{4} to match lines starting with a TIMESTAMP_ISO8601 (e.g 2017-11-13 17:05:06,931) or an Apache-like timestamp (e.g 02-Jan-2018).
The multiline.negate option, tells whether or not the multiline.pattern is negated. It means that if multiline.negate is false (by default) it will continue reading as long as it finds the specified pattern, and if the multiline.negate is true it will read several lines until it finally finds the pattern.
For further details on these options and especially on the multiline.match option, please refer to the following link: https://www.elastic.co/guide/en/beats/filebeat/current/multiline-examples.html
Kibana visualization configuration
Browse collected and parsed data
No more configuration is needed to see in Kibana the collected and parsed data. You should only go to the “Discover” tab and select the “logstash-*” index pattern.
Here below is an example an Error message that was parsed to retrieve the log level:
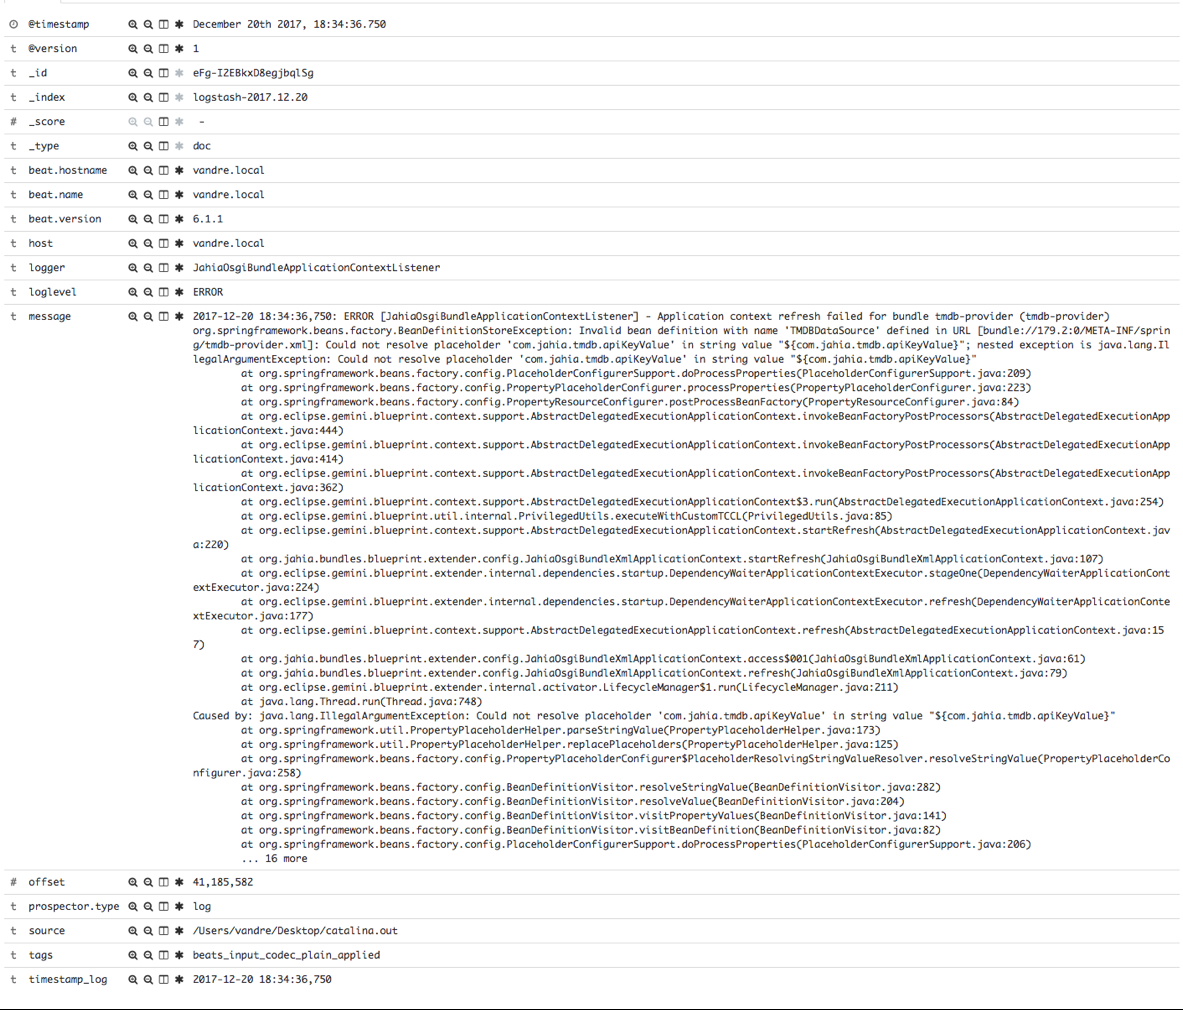
Figure 11 - An Error log level message collected and parsed
You can see that the log level was correctly parsed as it is now put in a “loglevel” field and the stack trace was entirely retrieved as part of the “message” field.
Build a Visualization
In order, to have a better view of the proportions of each log levels (errors, warning, info, debug etc.), we will build a Pie visualization thanks to the parsed data.
To do so:
- Access Kibana
- Click on the “Visualize” tab
- Click on the “+” button
- Click on the “Pie” button
- Click on the “logstash-*” index pattern
- Click on the arrow close the “Slice Size” label
- Choose “Count” as aggregation mechanism and input the label you would like
- Under the “Buckets” section, click on the arrow close to the “Split Slices” button
- Choose “Terms” as Aggregation mechanism
- Choose “loglevel.keyword” as Field
- Order in the Descending order and choose a size of 5
- Input the label you would like
- Click on the “Play button” close to the “Panel settings” tab
Please find here below a screenshot of the settings we chose along with the Visualization’s rendering:
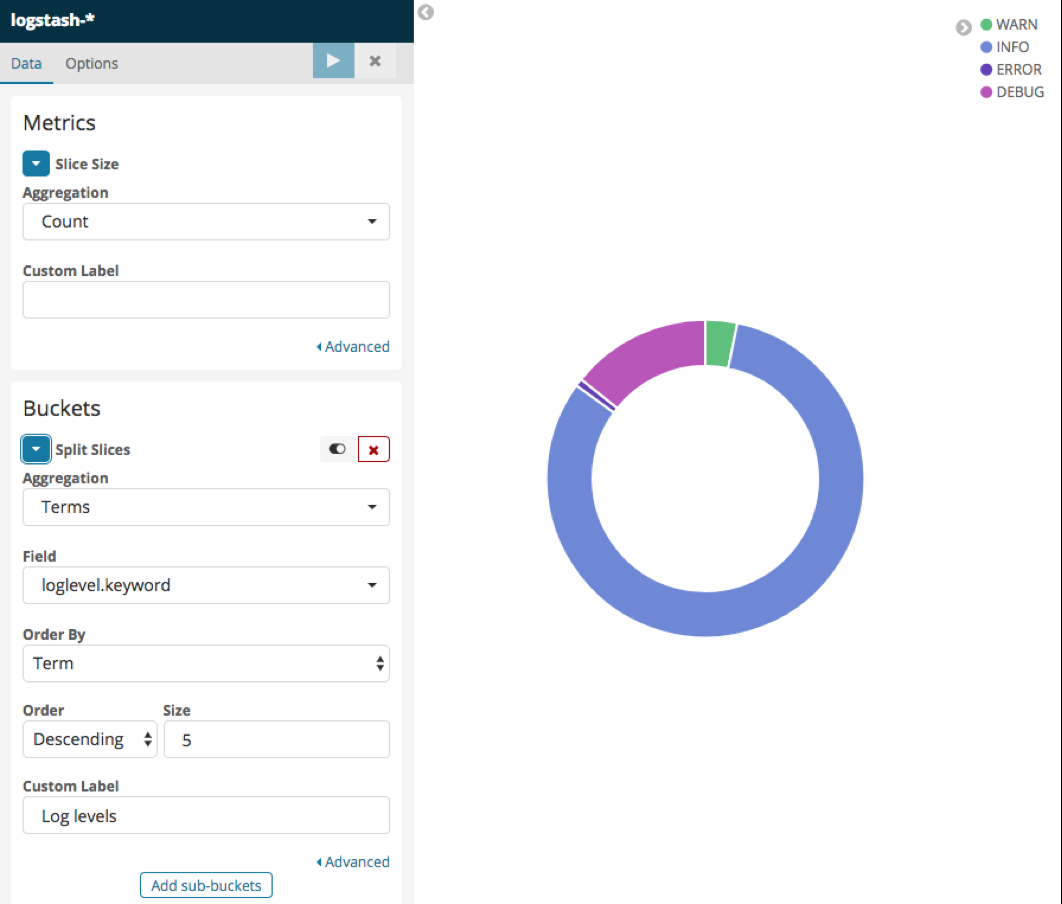
Figure 12 - The Log level Pie Visualization along with its settings
If the rendering suits you, save the visualization:
- Click on the “Save” button at the top of the window
- Input “[Jahia] Log Levels” as title and click on “Save”
VISUALIZATIONS AND DASHBOARDS
REGROUP VISUALIZATIONS IN A JAHIA DASHBOARD
Prior to regrouping visualizations into a dashboard, each visualization should be saved.
If you followed the Part 4, you should now have 3 visualizations saved:
- [Jahia] Average JCRSessionLoad
- [Jahia] Average RequestLoad
- [Jahia] Log Levels
To regroup them into a Jahia Dashboard:
- Access Kibana
- Click on the “Dashboard” tab
- Click on the “+” sign
- Click on the “Add” button and select the “[Jahia] Average JCRSessionLoad” and click on “Add new Visualization”
- Click on the “Add” button and select the “[Jahia] Average RequestLoad” and click on “Add new Visualization”
- Click on the “Add” button and select the “[Jahia] Log Levels” and click on “Add new Visualization”
- Replace the visualizations you just added where you want them to appear
- Click on the “Save” button at the top of the window
- Input “[Jahia] Dashboard” as title and click on “Save”
Once you are done with these steps, you should have a functional [Jahia] Dashboard (Cf. Figure 13).
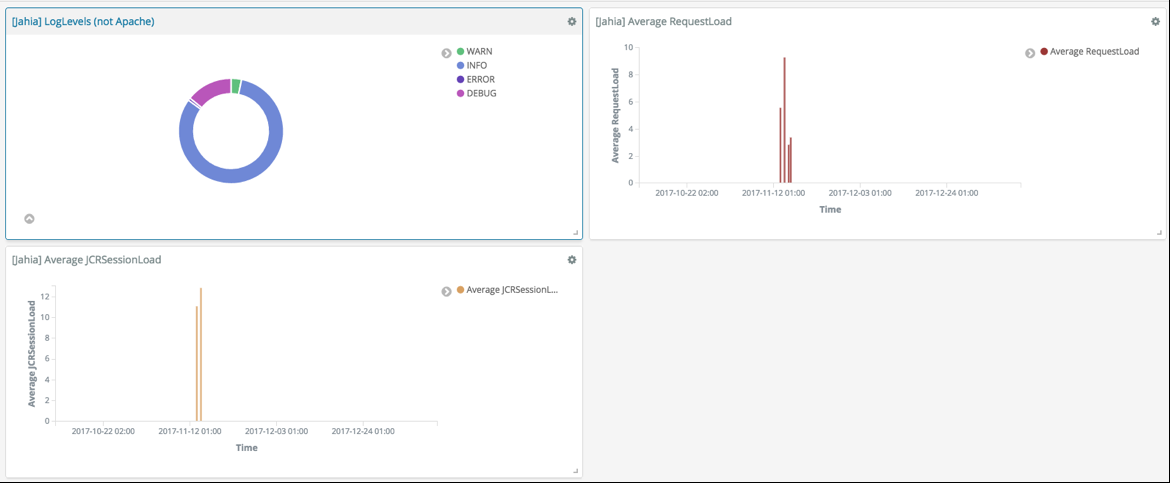
Figure 13 - The basic [Jahia] Dashboard
EXPORT VISUALIZATIONS AND DASHBOARDS
Dashboards and visualizations can easily be exported to a JSON file. As an example, we will export the Jahia dashboard and its visualizations. To do so:
- Access Kibana
- Click on the “Management” tab
- Click on “Saved Objects”
- Select the “Dashboards” tab
- Select the “ [Jahia] Dashboard” and click on “Export”
- Select the “Visualizations” tab and select all the visualizations that make up the “[Jahia] Dashboard” and click on “Export”
Please note that when you export a dashboard, it does not automatically export its visualizations. It should be done as a second step.
The import process is a bit trickier as the visualizations should be imported before the dashboard they compose.
So first import the Jahia’s visualizations:
- Access Kibana
- Click on the “Management” tab
- Click on “Saved Objects”
- Click on the “Import” button
- Select the JSON file that corresponds to the Visualizations
- Click on the “Yes, overwrite all”
- On the next panel select the “New index pattern”, in our case the “logstash-*” index pattern. It can be whatever index pattern you would like but it should have the fields required by the visualizations you are importing.
- Click on “Confirm all changes”
The “[Jahia] Dashboard” can now be imported:
- Access Kibana
- Click on the “Management” tab
- Click on “Saved Objects”
- Click on the “Import” button
- Select the JSON file that corresponds to the “[Jahia] Dashboard”
- Click on the “Yes, overwrite all”
The Jahia dashboard and visualizations should now be imported. Please make sure it looks like the Figure 13.
FEEDBACK ON THE EXPERIENCE
From our experience, it makes no doubt that the ELK stack streamlined the process of retrieving key information from logs. These information once requested or put into charts can help monitoring as well as troubleshooting a faulty system.
It is not particularly difficult to setup the stack to address simple needs as the default configuration is most of the time enough. However, tweaking the default configuration, involves dealing with several complex concepts and in this case, the learning curve is not trivial. This is mainly due to the fact that it is not a fully integrated product but a stack of tools that could almost work independently.
In any cases, the stack’s setup should be done by technical persons as this process is not easy enough to be carried out by others. On the other hand, the tools themselves can be used and be relevant to both technical and non-technical people. For instance, retrieving the number of errors that appear in the logs can be relevant to all audiences, as it can give a clue to the product quality over time.
More than ever, the ELK stack shows how interesting and useful can be the information stored in logs. By keeping key information within easy reach, it helps addressing several Jahia needs (not just the ones we reviewed), but it goes way beyond the Jahia scope as it is highly modular and customizable. Therefore, it seems to be quite clear that any organization could benefit of setting up such tools to monitor at least one part of its IT infrastructure.