Creating and editing optimization tests on content templates
Context
Content templates are templates used in Jahia DX for contents that needs to be displayed as a full page. Typically, content templates can be used for articles or products. The feature "Optimization test on content templates" allow you to AB test a new version of a content template so that you can know for sure if your new article or produt template is more efficient.
A. Creation / Edition
1. Type
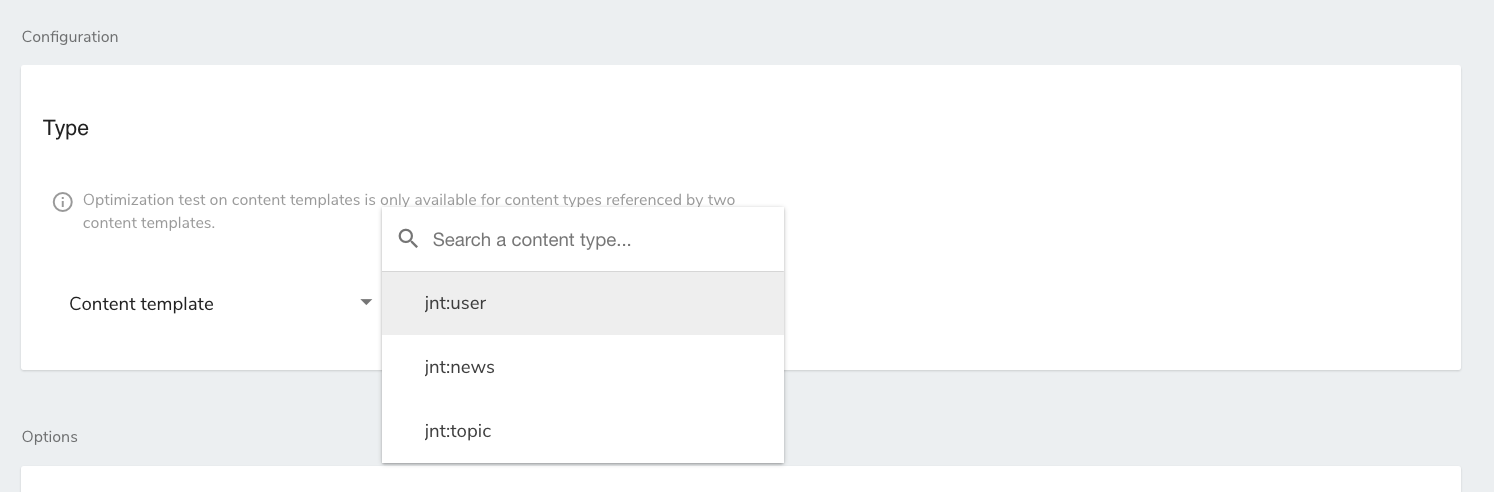
When creating an optimization test, you'll first need to:
1. Select an object type: In Marketing Factory 1.9.0, only "content templates" are available.
2. Select a content type: If you want to AB test a content template that is applied to products, select "yournamespace:product".
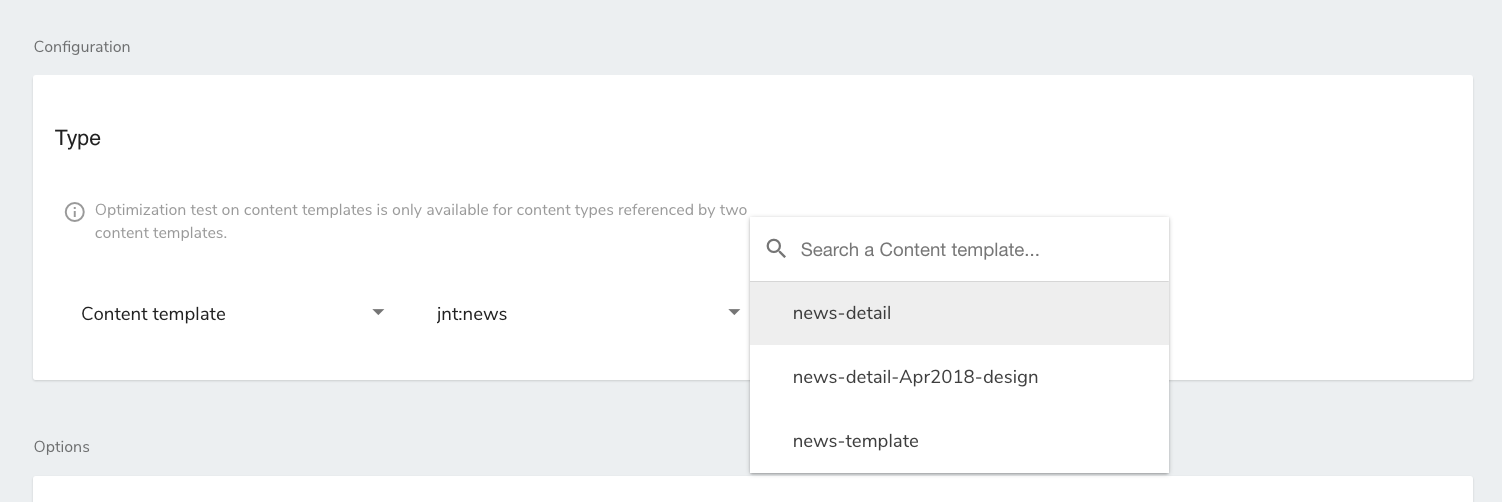
1. Select the content template that you want to test. You need to select the content template is currently being displayed to all your visitors when the content is displayed in full page. It will be your default variant.
3. Variants
Once your default variant is set, you'll need to select one or several other content templates. Set a name and save.

4. Traffic allocation
For each variant, set the traffic allocation. The total of the traffic allocation of every variants should be 100%.

5. Duration
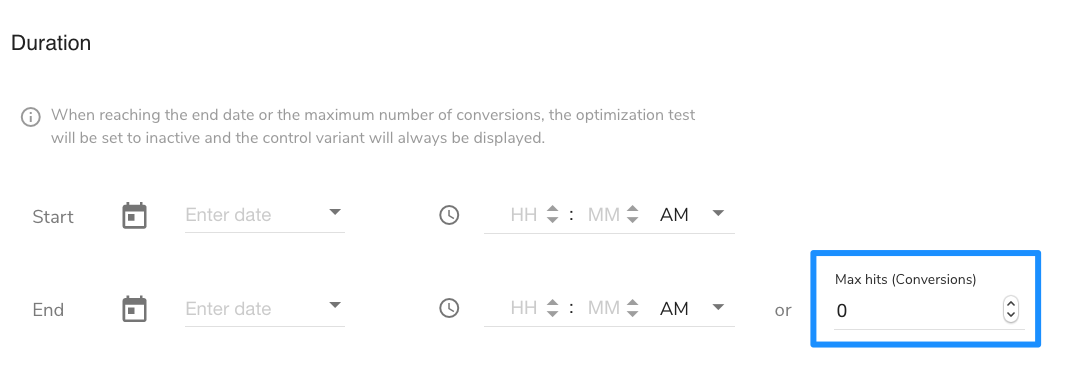
By default, your optimization test will be running when you hit save. If you want to limit its duration, you can choose a start and end date.
It is also possible to set a maximum number of hits: when the goal of the optimization test has been converted more times than this number, the test will stop. Set it to 0 if you want the threshold to be ignored.
6. Goal
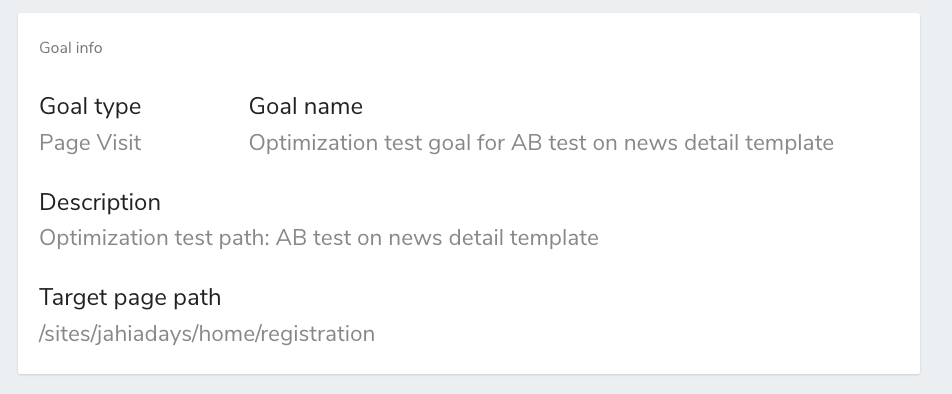
To compare the performance across your variations, you need to setup a goal. The only goal type available today is "page visit".
Set the goal type to "page visit"
Select the page that you want to use as your goal page.

B. Reporting
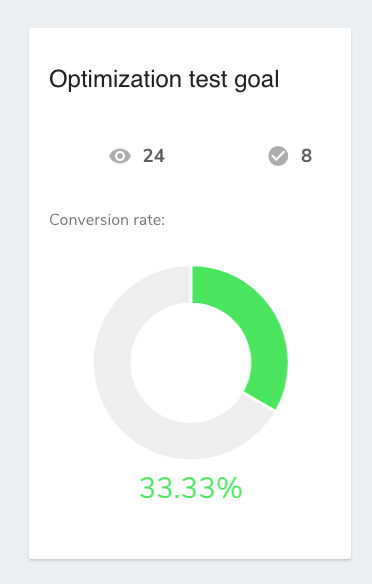
1. Left card
On the left card, the first two numbers are:
- Total number of views for all variants
- Total number of conversion variants
- Below, the conversion rate for all variants is displayed
2. Main card
The main card is made of 3 elements: The date picker, the chart and the datatable.
Date picker
The date picker will filter data on the chart and on the datatable.

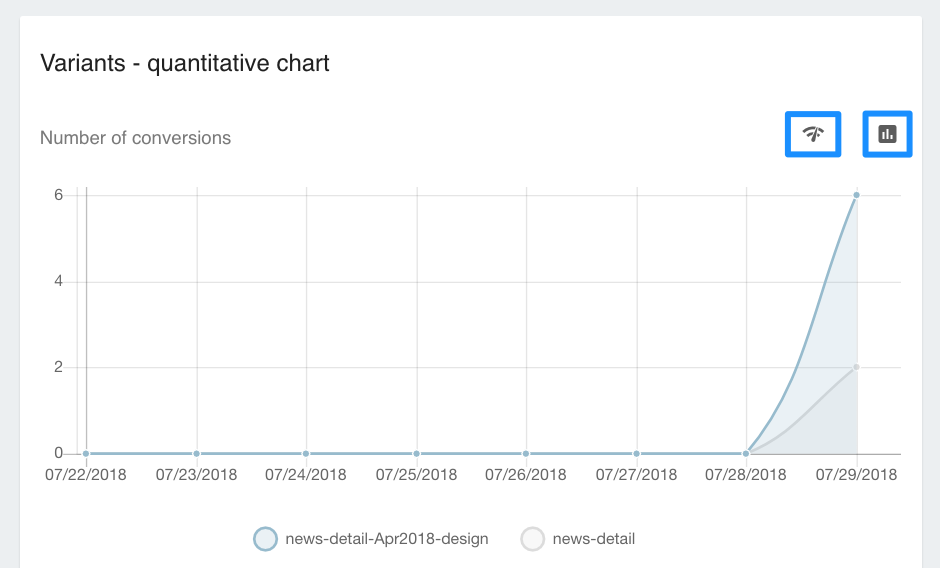
Chart
Besides the date picket, the chart can be configured in three ways:
- At the top right, the first button will change the chart to "performance" instead of quantitative. The chart will then display the evolution of the conversion rate for each variant.
- At the top right, the second button will change the chart to a "bar" chart instead of a line chart
- Below the chart, it is possible to click on each variant to remove it from the chart and for example focus on the other variants.
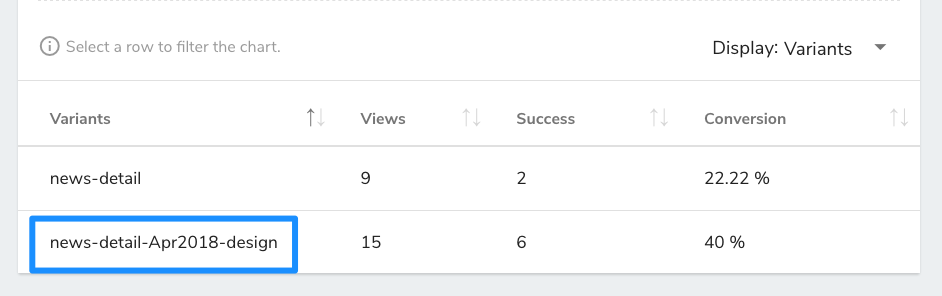
Datatable
By default, the datatable list the variants with the following data
- Number of times the variant was viewed
- Number of conversions after the variant was seen in the visit
- Conversion rate

Drill down filtering
In the datatable, it is possible to click on each line and therefore filter the datatable and the chart above.
For instance, if you want to focus on the performances of a specific variant:
The chart and the datatable will then give you new information:
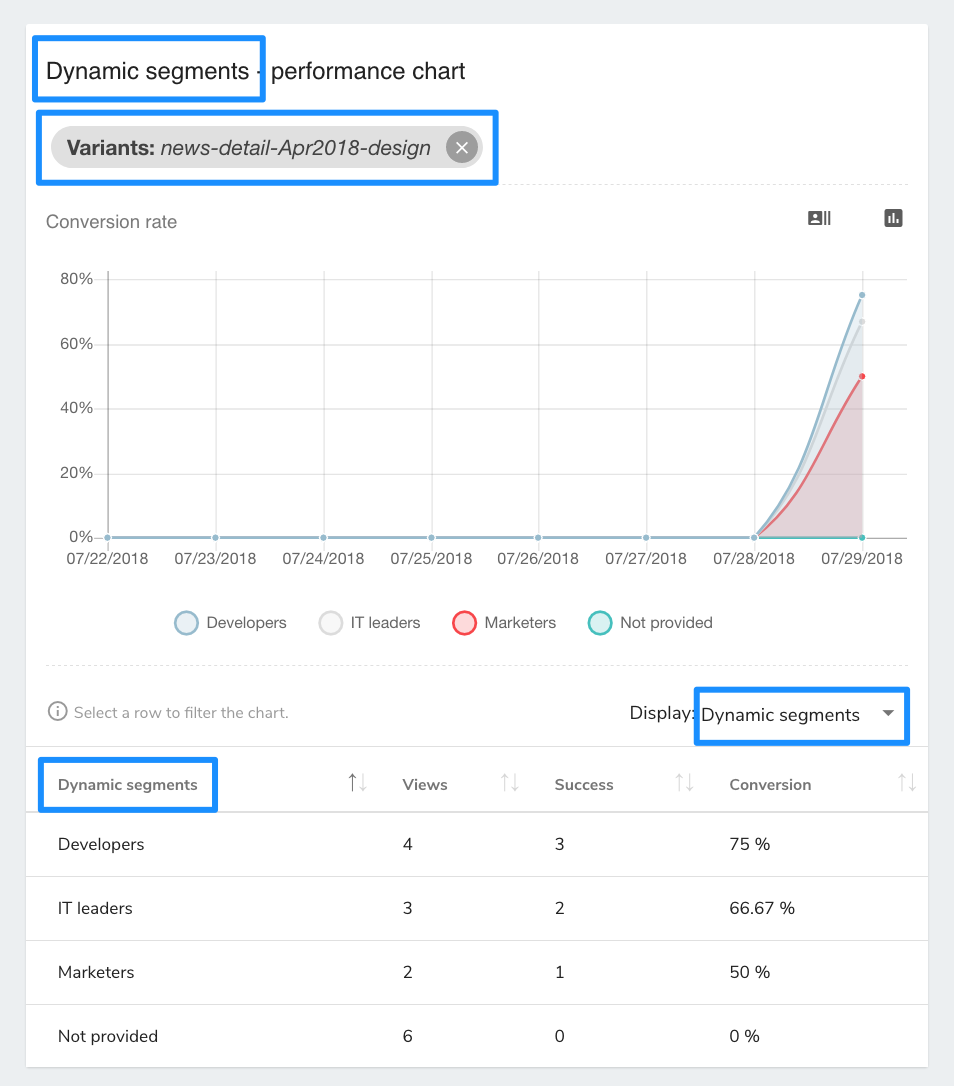
The chart now displays the conversion rate details for each segment regarding the selected variant.
3. Goal info
As a reminder, goal info are displayed below the main card.