Performance and capacity planning
While developing jCustomer we regularly measure system performance to get a sense of jCustomer capacity characteristics, understand jCustomer behavior under load as well as assess whether changes to our codebase have an impact on performance.
In this document, we’re presenting our approach to performance tests and provide results based on environments we tested jCustomer in.
Performance testing is a complex domain, in which opinionated decisions are made. Please take the time to read and understand the approach we took, prior to reviewing the actual performance metrics.
Approach
Our primary objective when measuring performance is to progressively increase user traffic until we notice degradation. While the tests are running, we collect response times and error rates associated with a particular throughput during that time as well as collect underlying resource utilization (CPU, RAM, disk, network…), allowing us to best pinpoint performance bottlenecks.
Definitions
Some of the terms mentioned in this document are used in the context of performance testing and are worth a few more details:
- ramp-up refers to the amount of time until all users within a run have been submitted.
- users refers to the number of users submitted by the end of the ramp-up time. A scenario itself is composed of multiple actions. The number of actions in a scenario can easily be calculated ,dividing the number of samples by the number of users.
- mean response time refers to response time across all of the scenario actions across all of the users. 50% of the queries are below that response time while 50% are above.
- 90%ile: 90% of the queries are below that response time while 10% are above
- 95%ile: 95% of the queries are below that response time while 5% are above
- 99%ile: 99% of the queries are below that response time while 1% are above
- Throughput: number of queries processed by the system per second
Testing environment
For this session of performance tests, the test environment was deployed in AWS Ireland (eu-west-1) on resources created specifically for these tests. The entirety of the test environment was destroyed and re-created between each run.
When designing the testing environment, we made the decision to rely on EC2 instances, with each instance running one single resource using docker. This allows for segregation of services and ensures measured metrics (and in particular system load) are specific to the exact resource being tested.
The following instance types were used during the tests:
- A (large) jMeter host
- A Jahia host serving the site
- One or more jCustomer hosts
- One of more Elasticsearch hosts
All instances and resources used for the tests are collocated in the same VPC (same region), exact specifications of the EC2 instances are provided next to the test results.
Anatomy of a run
A single performance test run is composed of elements that do not change during the run, such as the testing environment, the ramp-up time, and the test scenario. The only variable element during the run is the number of users, which is progressively increased until the environment begins to fail.
balance the wish for extensive data samples with the desired execution time for the test. Therefore it’s usually best to identify ranges of interest (see profiles detailed below) and focus the analysis on these.
At the end of a run, we gather the data collected by jMeter in a format that facilitates its interpretation.

Results (metrics) of performance run #1
We can generally group the results in the 4 different profiles described below.
Result profile: Under-utilized
The system is under-utilized as the load it receives from jMeter is not sufficient for it to be stress-tested. Results with this profile usually have a very similar latency but different Throughput.
Such results are still relevant as they provide us with a sense of the fastest response time supported by the environment.
For example, on the results above, we can see that the environment’s response time behaves similarly between 25 and 100 users.
In general, you would want to avoid being in that profile for extended periods as it means you are spending more on the environment than necessary.
Result profile: Optimum performances
The environment response time is situated within optimum operating conditions as defined by the business.
For example, if the desired response time is set by the business at 250ms on the 90%ile, the optimum environment would be able to support the number of users at or next to that value. In the results above this would be somewhere close to 150 users (287ms at 90%ile).
This is the sweet spot and the capacity you should be aiming towards for your environment.
Result profile: At capacity
The system is performing at its peak with limited queuing and without errors. This profile can be identified by looking for a flattening in the throughput curve (see chart above).
For example, in the results above you will notice that throughput is at its peak at 300 users (throughput of 213q/s). It means that the maximum capacity supported by the infrastructure is situated around 300 users. The environment should be in a position to sustain such a load, with degraded performances (above “optimum performances”) over a long period of time without erroring out, although you would want to monitor memory consumption.
Although you wouldn’t want your environment to operate in this profile, this could still be acceptable for worst-case scenarios, for example for an unexpected increase in traffic and while your infrastructure team is working at increasing capacity. This mostly corresponds to the load your environment should never go above.
Result profile: Over-utilized
The system is performing over its capacity and will begin queuing requests, progressively increasing its memory usage and dramatically increasing response time until it starts erroring-out.
This typically is the next step just after the “at capacity” profile. In the example above we reached that point above 300 users and began noticing errors at 800 users.
This is the no-go zone, reaching that type of load should trigger immediate actions from your operations team.
Test scenario - a user journey
Creating a user journey is complex in nature. For these performance tests, we used product-relevant features, while navigating across these features following a use case representative to the expected usage of these features in production.
Test site
The site supporting the user journey is composed of 3 pages:
- Page 1 contains 3 personalized areas (with server-side rendering) using Geolocation, Scoring plan and Goal. It contains a tags aggregation component and is also considered the site’s home page.
- Page 2 contains 3 personalized areas (with client-side rendering) using the segment “onePage”, the session property “browser” and the profile property “utm_campaign”.
- Page 3 contains a form with 3 fields (email, firstname, lastname) mapped to the corresponding jExperience profile property.
User journey
When navigating, the test user will follow this scenario:
- Open page 1 with a campaign parameter and stay on the page for 2 seconds
- Navigate to page 2 and stay on the page for 2 seconds
- Navigate to page 3, submit the form, which will fulfill a “newsletter” goal, and stay on the page for 2 seconds
- Navigate to page 1, a new personalization is displayed due to the “newsletter” goal being fulfilled and stay on the page for 2 seconds
- Navigate to page 2 and stay on the page for 2 seconds
For each of the steps in the user scenario, we verify that the personalization properties are correctly resolved and displayed.
The entire user journey was measured at 15 seconds during our tests, we are repeating it twice for each user, bringing the total user journey to 30 seconds per user.
System load profile
Having a jMeter ramp-up time of 10 seconds jointly with a total user journey of 30 seconds means that the last users should complete their journey 40s after the start of the test.
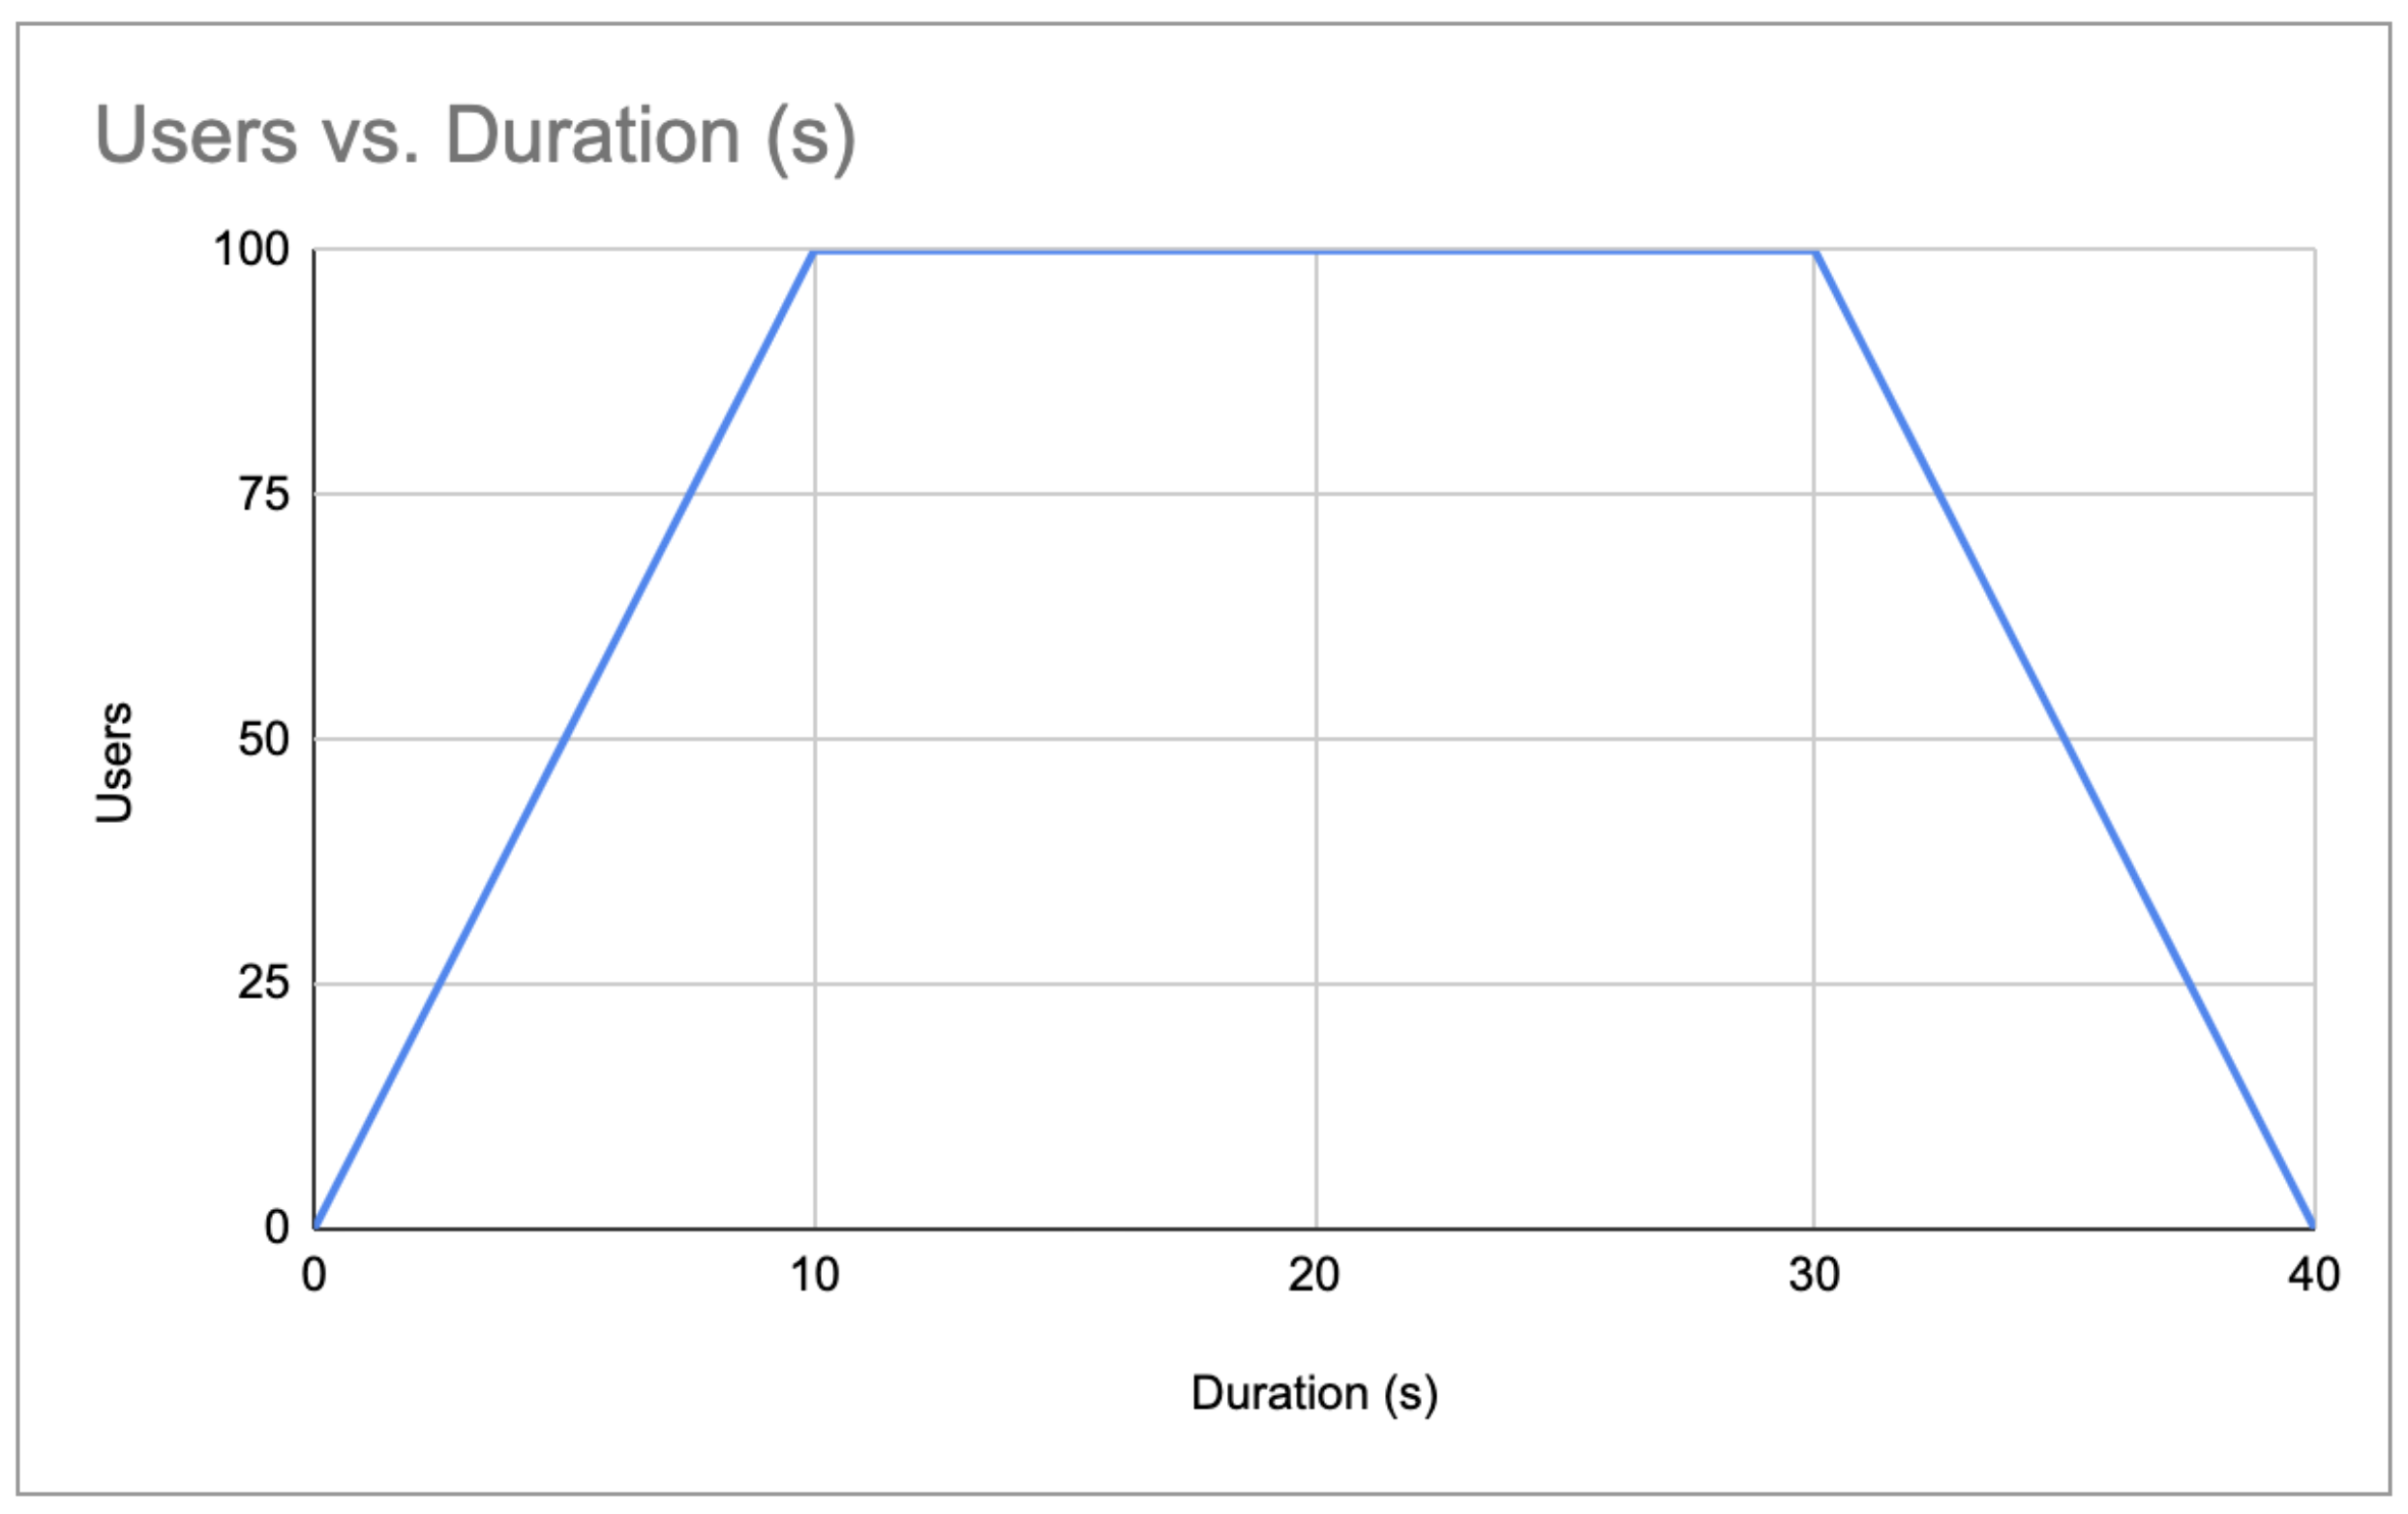
System load profile with 100 users
For about 20s (between T+10 and T+30), all of the users will be on the platform at the same time, which gives us a pretty good understanding of the supported load in that use case.
Another important element to keep in mind when reviewing performance metrics is that these metrics correspond to the average values across an entire scenario for one particular user. While the response time could be 250ms for a given run, this value is itself an average of all of the queries performed by the user within a scenario.
Note of caution
jCustomer is a complex product, offering flexibility in implementing a wide range of use cases. Although flexibility is key for such a platform, it also makes performance results very specific to the implemented use case on that precise environment being tested.
In other words, the results presented in this document offer a baseline to help you understand how performance metrics evolve as the underlying infrastructure is being modified. It also helps in pinpointing infrastructure bottlenecks as environments are being spec’d out.
Except if you were to run the same test scenario, it is very important to put a strong emphasis on the fact that YOU WILL NOT obtain the same performance metrics on your production environment. And although we designed the test scenario to be representative of a typical jCustomer use case, such a scenario remains a static implementation and by nature cannot be compared to the variability introduced when dealing with “real-world” users in a production environment.
Performance tests
In these tests, we’re going to start with very small resources, progressively increase their size and see how this impacts metrics.
The threshold for optimum performance is set at 250ms on the 90%ile.
All tests will be running with a c5.9xlarge jMeter instance (36 vCPU, 72GB RAM) which provides sufficient throughput while not becoming the bottleneck in any of the planned runs. Jahia itself will be running on a small instance, and although Jahia is not on the critical path for this test, we’re making sure Jahia resources utilization remains low during the test to confirm it is not becoming a bottleneck.
Please note that deploying a single-node Elasticsearch instance is not recommended by Elastic in production due to the risk of data loss, it is presented here as it is useful to understand bottlenecks.
Run #1
| Environment | |
|---|---|
| Name | Specs |
| jCustomer | t2.medium (2 vCPU, 4GB RAM) |
| Elasticsearch | t2.medium (2 vCPU, 4GB RAM) |
| Profiles | ||||
|---|---|---|---|---|
| Under-utilization | Optimum performances | At capacity | Over-utilized | |
| Range (users) |
up to 100 |
150 |
250 |
above 300 |
|
Latency (mean) |
38ms |
111ms |
483ms |
605ms |
|
Latency (90%ile) |
82ms |
287ms |
1064ms |
1248ms |
|
Latency (95%ile) |
112ms |
359ms |
1208ms |
1336ms |
|
Latency (99%ile) |
199ms |
524ms |
1414ms |
1517ms |
|
Throughput |
117q/s |
162q/s |
194q/s |
213q/s |
| Run Analysis |
|---|
|
This run was performed using small and identical instances and serves as a baseline for all subsequent runs detailed in this document. Resource usage on the host running Elasticsearch was pretty high, which tends to indicate it was the bottleneck for that particular run. In th next run (#2), we are increasing resources on this node to confirm the impact on performance. |
Run #2
| Environment | |
|---|---|
| Name | Specs |
| jCustomer | t2.medium (2 vCPU, 4GB RAM) |
| Elasticsearch | t2.xlarge (4 vCPU, 16GB RAM) |
| Profiles | ||||
|---|---|---|---|---|
| Under-utilization | Optimum performances | At capacity | Over-utilized | |
| Range (users) |
up to 200 |
250 |
400 |
above 450 |
|
Latency (mean) |
99ms |
116ms |
446ms |
606ms |
|
Latency (90%ile) |
239ms |
288ms |
923ms |
1188ms |
|
Latency (95%ile) |
302ms |
354ms |
1012ms |
1354ms |
|
Latency (99%ile) |
400ms |
465ms |
1220ms |
1577ms |
|
Throughput |
221q/s |
270q/s |
320q/s |
317q/s |
| Run Analysis |
|---|
| As expected when analyzing the outcome of run #1, the Elasticsearch node was the bottleneck and increasing its capacity did have a significant impact on measured performances. In this new run, the environment supported precisely 100 more users in the “optimum performances” profile. |
Run #3
| Environment | |
|---|---|
| Name | Specs |
| jCustomer | t2.xlarge (4 vCPU, 16GB RAM) |
| Elasticsearch | t2.xlarge (4 vCPU, 16GB RAM) |
| Profiles | ||||
|---|---|---|---|---|
| Under-utilization | Optimum performances | At capacity | Over-utilized | |
| Range (users) |
up to 200 |
300 |
450 |
above 500 |
|
Latency (mean) |
53ms |
119ms |
389ms |
502ms |
|
Latency (90%ile) |
134ms |
311ms |
778ms |
1027ms |
|
Latency (95%ile) |
183ms |
386ms |
914ms |
1385ms |
|
Latency (99%ile) |
294ms |
509ms |
1202ms |
1926ms |
|
Throughput |
232q/s |
318q/s |
378q/s |
373q/s |
| Run Analysis |
|---|
|
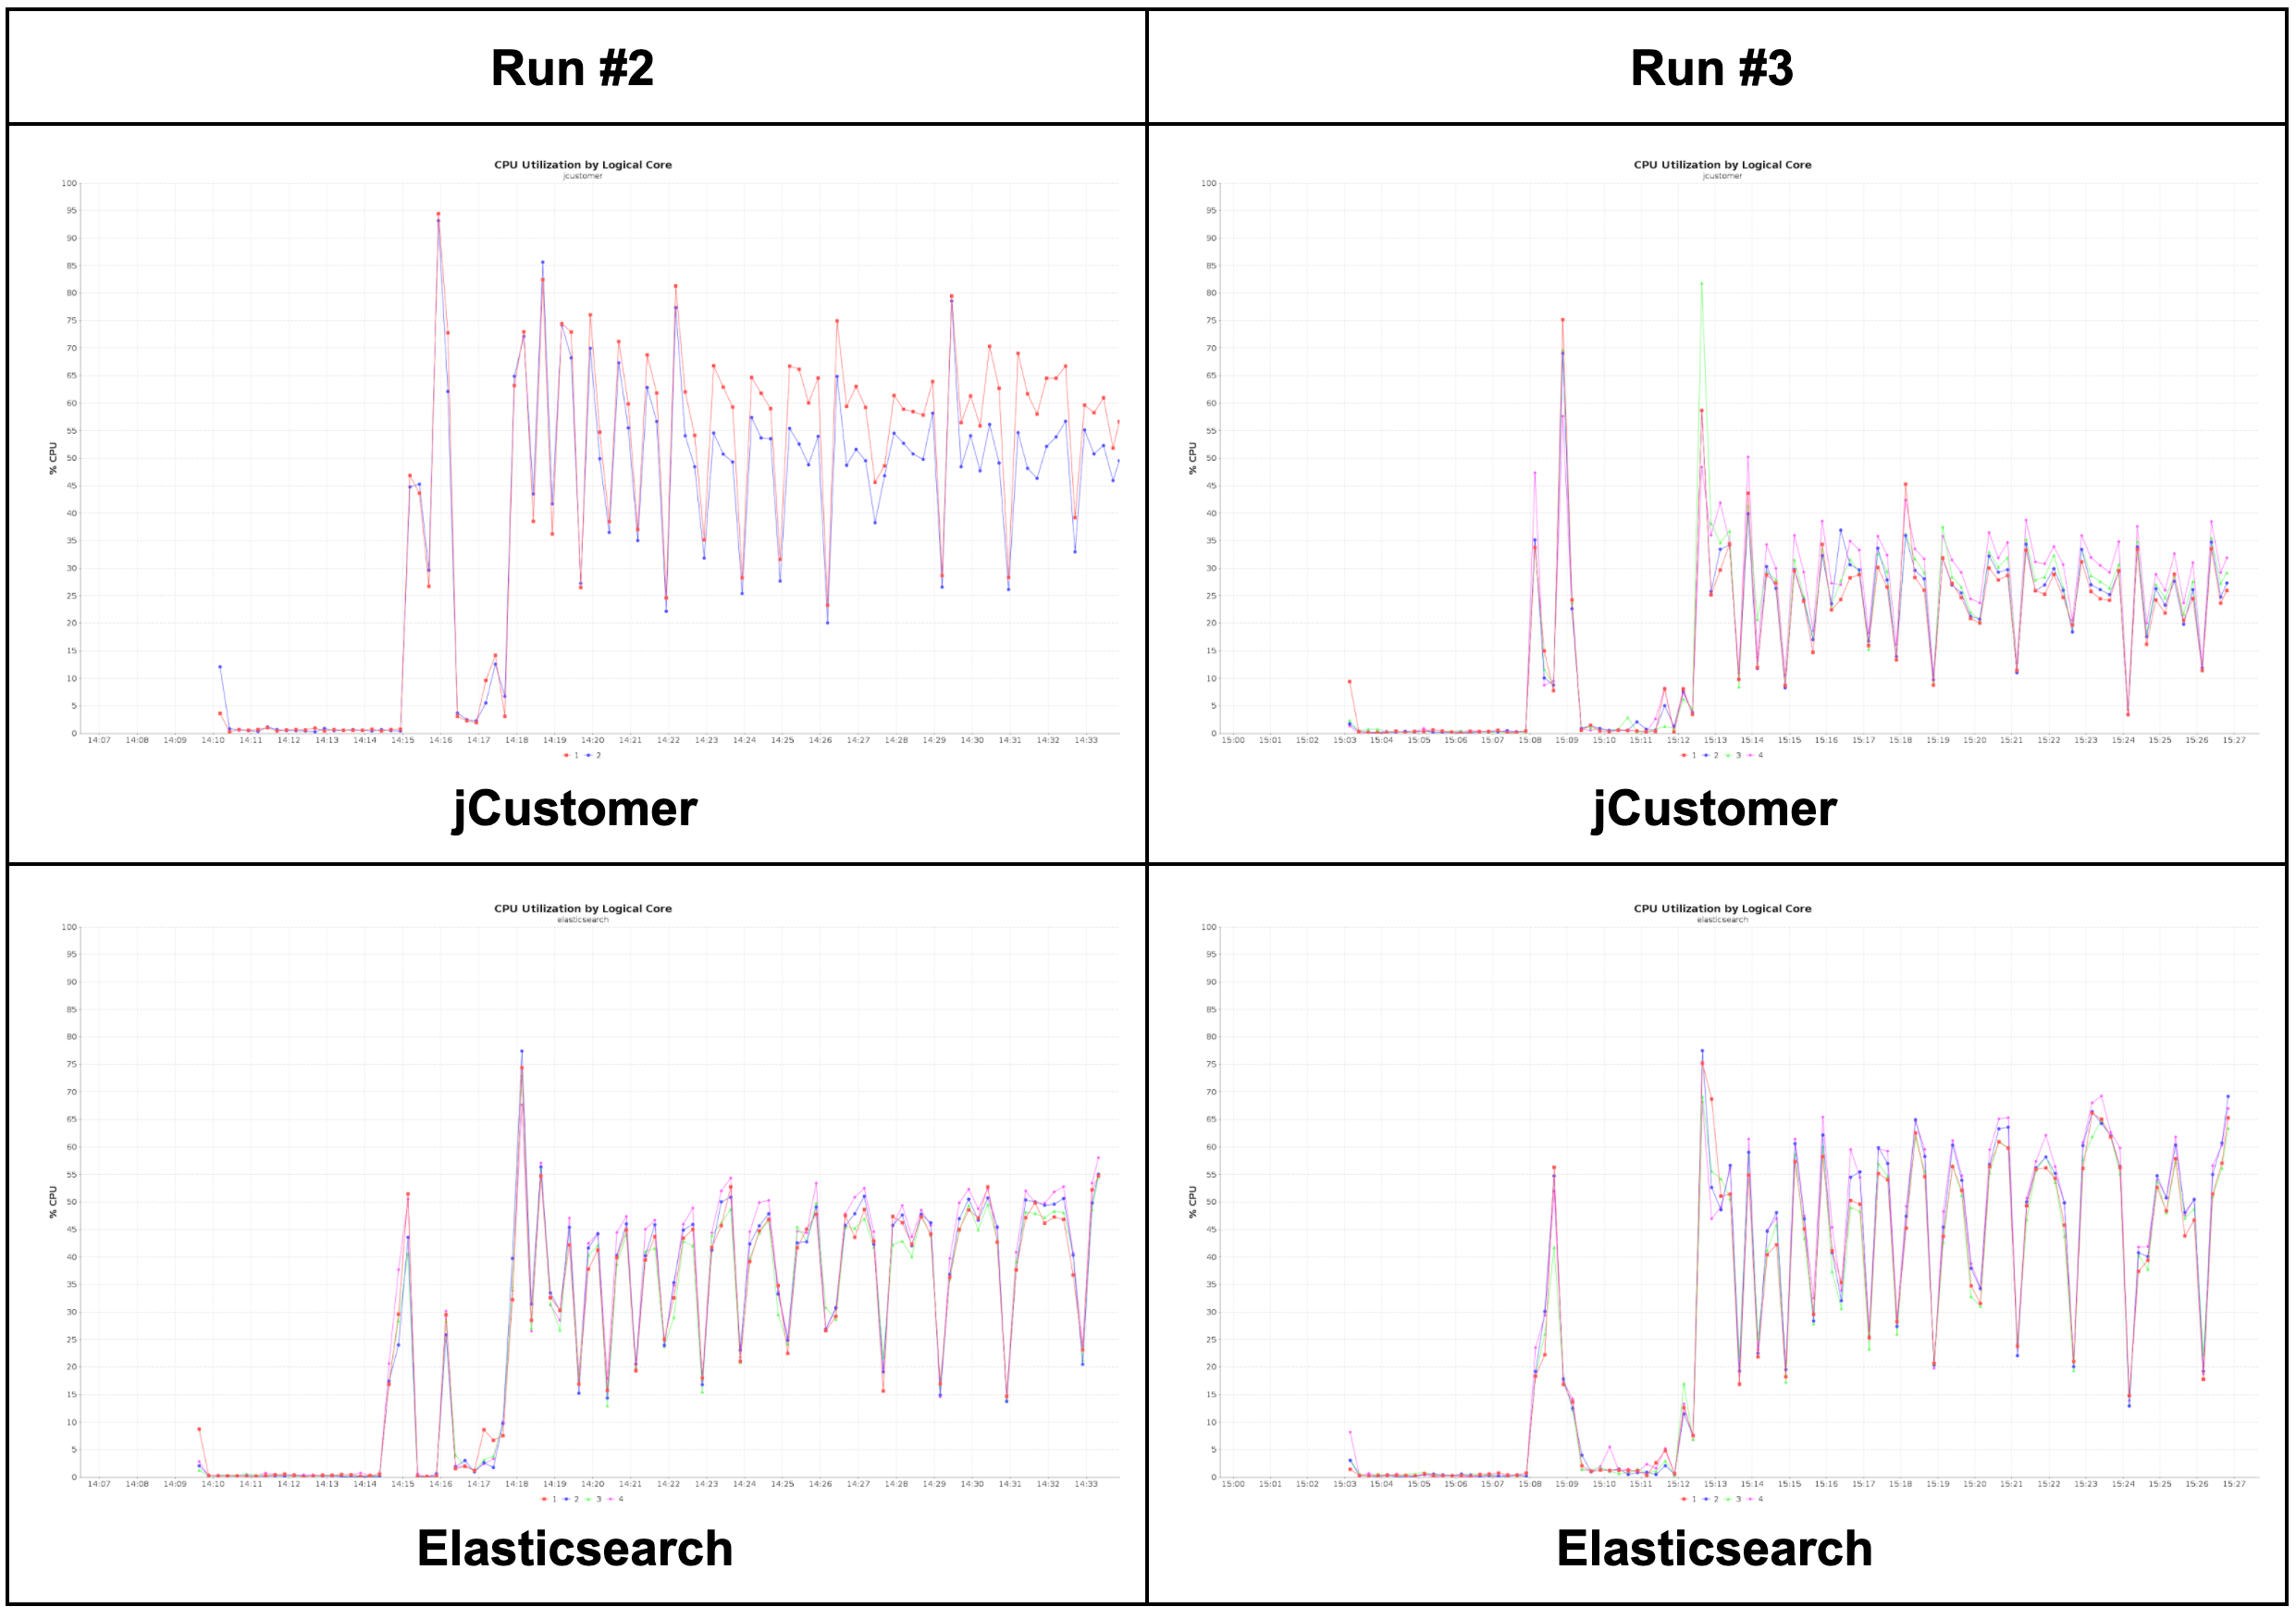
The main purpose of this run is to increase capacity on the jCustomer host and compare the result with run #2 to see its impact on performance.
When we look at how jCustomer CPU usage decreases between the two runs while Elasticsearch CPU usage increases. It means that the jCustomer host (2 vCPU, 4GB RAM) in run #2 was actually the performance bottleneck but not by a significant margin. Increasing the jCustomer host in run #3, did indeed increase performances, but you can see by looking at CPU usage that the bottleneck in that case became the Elasticsearch host. |
Run #4
| Environment | |
|---|---|
| Name | Specs |
| jCustomer | 3x t2.medium (2 vCPU, 4GB RAM) |
| Elasticsearch | 3x t2.medium (2 vCPU, 4GB RAM) |
| Profiles | ||||
|---|---|---|---|---|
| Under-utilization | Optimum performances | At capacity | Over-utilized | |
| Range (users) |
up to 200 |
300 |
800 |
above 900 |
|
Latency (mean) |
41ms |
83ms |
875ms |
995ms |
|
Latency (90%ile) |
82ms |
202ms |
1810ms |
2068ms |
|
Latency (95%ile) |
108ms |
279ms |
1942ms |
2407ms |
|
Latency (99%ile) |
202ms |
422ms |
2185ms |
2888ms |
|
Throughput |
231q/s |
331q/s |
469q/s |
469q/s |
| Run Analysis |
|---|
|
In this run we are deploying an environment containing the same hardware specs than run #1, but deploying jCustomer and Elasticsearch as a cluster, we can draw the following conclusion from the results: Performance results for the “optimum performances” profile are very similar to run #3 (with slightly better latency). Although it would be inaccurate to provide the blanket statement (1x t2.xlarge = 3x t2.medium), the performance metrics are indeed relatable. The environment in run #4 is much more capable of handling loads above the “optimum performances” profile, for example the “at capacity” profile in run #4 is at 800 users while it was at 450 users in run #3. This is due to the nature of cluster deployments, which allows the load to be spread between multiple hosts. So aside from providing redundancy, cluster based environments will be more capable of handling bursts in visitor traffic than single-node environments. |
Run #5
| Environment | |
|---|---|
| Name | Specs |
| jCustomer | 3x t2.xlarge (4 vCPU, 16GB RAM) |
| Elasticsearch | 3x t2.xlarge (4 vCPU, 16GB RAM) |
| Profiles | ||||
|---|---|---|---|---|
| Under-utilization | Optimum performances | At capacity | Over-utilized | |
| Range (users) |
up to 500 |
700 |
1100 |
above 1400 |
|
Latency (mean) |
43ms |
102ms |
437ms |
691ms |
|
Latency (90%ile) |
89ms |
216ms |
1017ms |
1198ms |
|
Latency (95%ile) |
128ms |
274ms |
1232ms |
1358ms |
|
Latency (99%ile) |
241ms |
397ms |
1690ms |
1655ms |
|
Throughput |
573q/s |
775q/s |
813q/s |
862q/s |
| Run Analysis |
|---|
| In this run, we are starting from the same base as run #4 but increasing the capacity of the underlying EC2 instances. As expected the user capacity supported by the environment grew (almost doubled when compared to run #4). One notable element here is the latency for the “at capacity” and “over-utilized” profiles, which appears to be better than the same profiles in run #4. This is a situation that was not present when comparing run #1 and run #3. This is more than likely a consequence of operating the environment in a cluster. |
Run #6
| Environment | |
|---|---|
| Name | Specs |
| jCustomer | 5x t2.medium (2 vCPU, 4GB RAM) |
| Elasticsearch | 5x t2.medium (2 vCPU, 4GB RAM) |
| Profiles | ||||
|---|---|---|---|---|
| Under-utilization | Optimum performances | At capacity | Over-utilized | |
| Range (users) |
up to 600 |
700 |
2000 |
above 2500 |
|
Latency (mean) |
60ms |
104ms |
1185ms |
1566ms |
|
Latency (90%ile) |
122ms |
256ms |
1720ms |
2635ms |
|
Latency (95%ile) |
175ms |
357ms |
2066ms |
3129ms |
|
Latency (99%ile) |
352ms |
603ms |
2775ms |
4486ms |
|
Throughput |
665q/s |
731q/s |
903q/s |
897q/s |
| Run Analysis |
|---|
| Finally, for the last run we are using the same base than run #4 but are increasing the number of nodes in the cluster. Results in this run are consistent with the previous elements highlighted in the previous ones. When compared to run #5, we do see similar results for the “optimum performances” profile, in which the “at capacity” and “over-utilized” profiles support a significantly greater number of users. |
Conclusions
Since the purpose of this page is to document performance metrics, we will begin by a summary table of the optimum capacity for the various environments tested.
| Run | Environment specs | Capacity | Measured performance |
|---|---|---|---|
| #1 | jCustomer: t2.medium (2 vCPU, 4GB RAM) Elasticsearch: t2.medium (2 vCPU, 4GB RAM) |
150 users | Latency (mean): 111ms Latency (90%ile): 287ms |
| #2 | jCustomer: t2.medium (2 vCPU, 4GB RAM) Elasticsearch: t2.xlarge (4 vCPU, 16GB RAM) |
250 users | Latency (mean): 116ms Latency (90%ile): 288ms |
| #3 | jCustomer: t2.xlarge (4 vCPU, 16GB RAM) Elasticsearch: t2.xlarge (4 vCPU, 16GB RAM)) |
300 users | Latency (mean): 119ms Latency (90%ile): 311ms |
| #4 | jCustomer: 3x t2.medium (2 vCPU, 4GB RAM) Elasticsearch: 3x t2.medium (2 vCPU, 4GB RAM) |
300 users | Latency (mean): 83ms Latency (90%ile): 202ms |
| #5 | jCustomer: 3x t2.xlarge (4 vCPU, 16GB RAM) Elasticsearch: 3x t2.xlarge (4 vCPU, 16GB RAM) |
700 users | Latency (mean): 102ms Latency (90%ile): 216ms |
| #6 | jCustomer: 5x t2.medium (2 vCPU, 4GB RAM) Elasticsearch: 5x t2.medium (2 vCPU, 4GB RAM) |
700 users | Latency (mean): 104ms Latency (90%ile): 256ms |
Although comparisons between the runs are available in the “Run Analysis” section of each run, this summary table and the following conclusions provides a good starting point for spec’ing out a jCustomer environment.
It is obviously recommended to run your jCustomer and Elasticsearch environment as a cluster, not only will it provide redundancy in case of failure, but it will also better cope with increased traffic (when compared to single-node large resources).
The environment scales very well, both vertically (bigger resources) and horizontally (more resources). The choice between scaling up a cluster vertically or horizontally depends on your infrastructure and its limitations. Vertical scaling a cluster offers simplicity of setup (less resources running), but you are limited by the physical capacity of the underlying resource. Horizontal scaling does not have such limitations but can involve a larger number of resources to set up/monitor/maintain.
In most cases, the Elasticsearch cluster’s capacity will be the performance bottleneck, make sure it is sized properly.
Finally, and although we’re still insisting that the tests performed for this document are specific and opinionated, and that they are not going to directly relate to your production environment, they also provide some insights about physical requirements of jCustomer.