Configuring Elastic Kibana & jExperience for analytics
The following document only applies if you are not using Jahia cloud. On Jahia cloud, jExperience analytics is installed and configured for all jExperience customers.
Before reading the following document, we recommend that you go through About jExperience analytics, where you'll be able to find the high-level architecture and an introduction to the components involved.
Prerequisites:
Jahia 8.1.8.0+
jExperience 3.7.0+
jCustomer - 3.0.0+
Kibana 9.0.0+
Elasticsearch 9.0.0+
Configuring Kibana to support connection from Jahia
Kibana requires a specific configuration in order for dashboards to be accessible directly from Jahia UI. In Kibana configuration file (config/kibana, you need to set the server.basePath parameter to "/modules/kibana-proxy" and restart the Kibana server.
Configuring the connection between kibana dashboard provider and Kibana The connection between Jahia and Kibana is configured with an osgi configuration file:
org.jahia.modules.kibana_dashboards_provider.cfg
This file is created during the deployment of the kibana dashboard provider module. It can be edited directly in the filesystem (in karaf/etc), Jahia’s provisioning API, Jahia’s GraphQL API or using the OSGI Web configuration in Jahia tools.
Kibana URL - The base URL of the Kibana server.
kibana_dashboards_provider.kibanaURL=http://localhost:5601
Credentials / Kibana user, password & role - The credentials will be used for several purposes: load dashboards that exist in kibana to display them in the jahia UI, import jexperience dashboards to kibana and automatically login jahia users inside Kibana to avoid the need of multiple authentication.
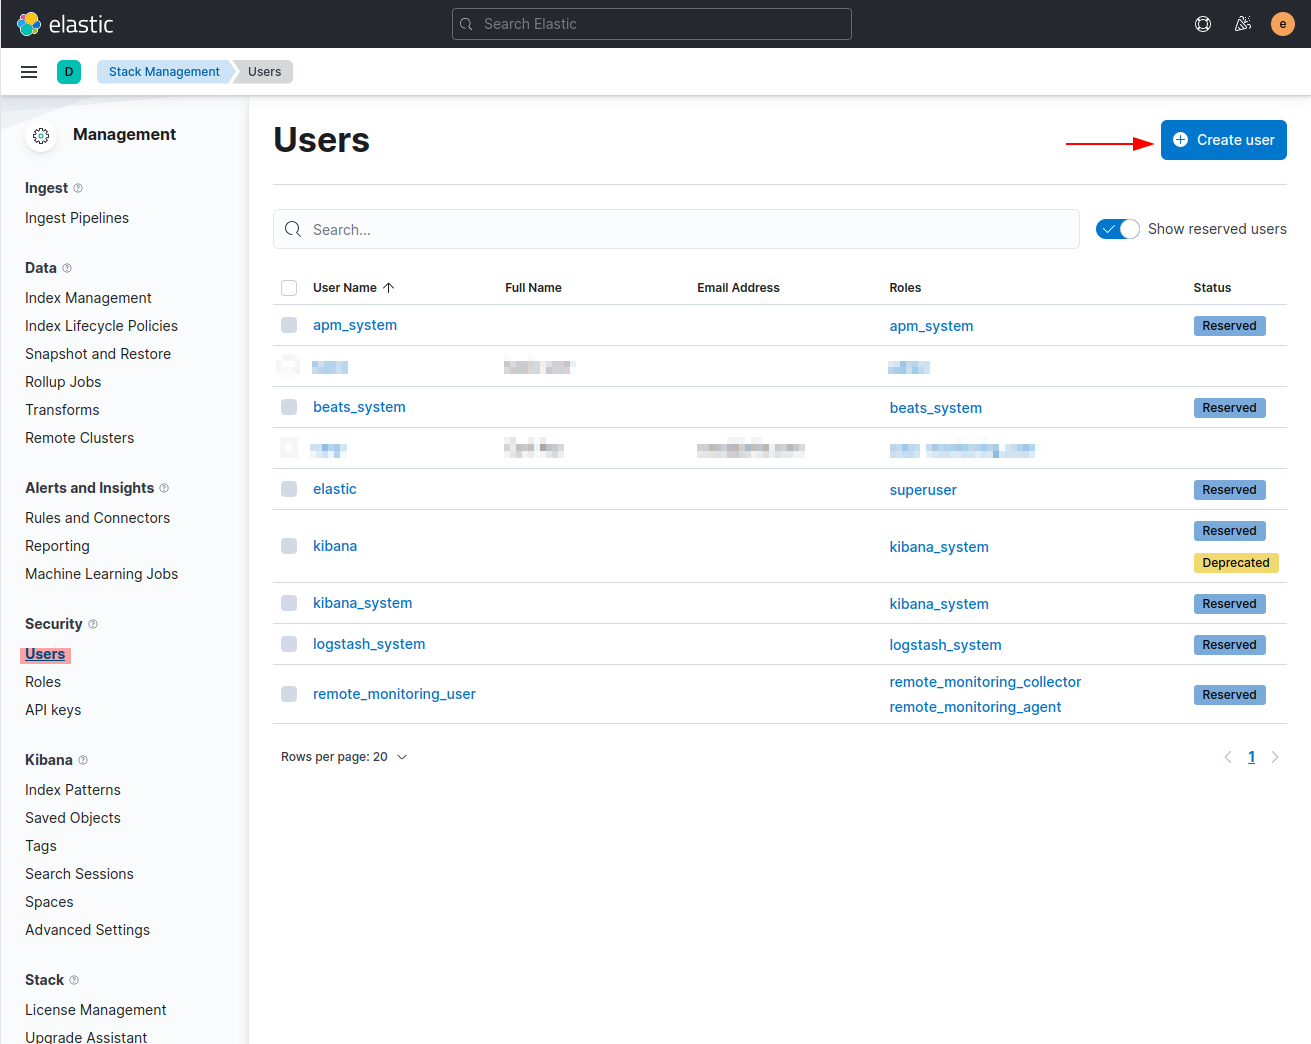
We strongly recommend not to use the default "elastic" super-user credentials here. Instead, create two new users account, one with the editor role and one with the viewer role. This can be done from Kibana by navigating to: Stack Management >> Security >> Users:
The "editor" user role is required here in order to automatically import the built-in dashboards provided by the "jexperience-dashboards" module (or if you use your own custom module that imports other Kibana dashboards). The "viewer" user role is sufficient to display the dashboards in Jahia UIs.
Note: If you didn't configure security of your kibana server, you can set any value in the users / passwords.
The properties used to define the users / passwords are the following: For example:
kibana_dashboards_provider.kibanaUser=kibana-reader
kibana_dashboards_provider.kibanaPassword=kibana-reader-password
kibana_dashboards_provider.kibanaWriter=kibana-writer
kibana_dashboards_provider.kibanaWriterPassword=kibana-writer-password
Kibana space(Optional) - This property is used to define which kibana space will be used. If this property is not specified, the Kibana space "default" will be used.
kibana_dashboards_provider.kibanaSpace = myKibanaSpace
The built-in dashboards brought by the "jexperience-dashboards" module are imported during module start in the "kibana space" defined the configuration. As a consequence, if you want to change this space, you will have to restart the "jexperience-dashboards" module so that the dashboards are automatically imported into your new space.
Proxy configuration - To avoid asking Jahia users to manually login to Kibana, you need to enable the proxy. The proxy will provide access to Kibana and will use the kibanaUser and kibanaPassword to authenticate. To ensure that the proxy is activated, set both following properties to true:
kibana_dashboards_provider.kibanaProxy.enable = true
kibana_dashboards_provider.kibanaProxy.cloud = true
Configuring permissions
By default, access to Kibana will be blocked for everyone (and corresponding menu entries will not show up in Jahia administration), it is required that an administrator enable access by configuring the necessary permissions.
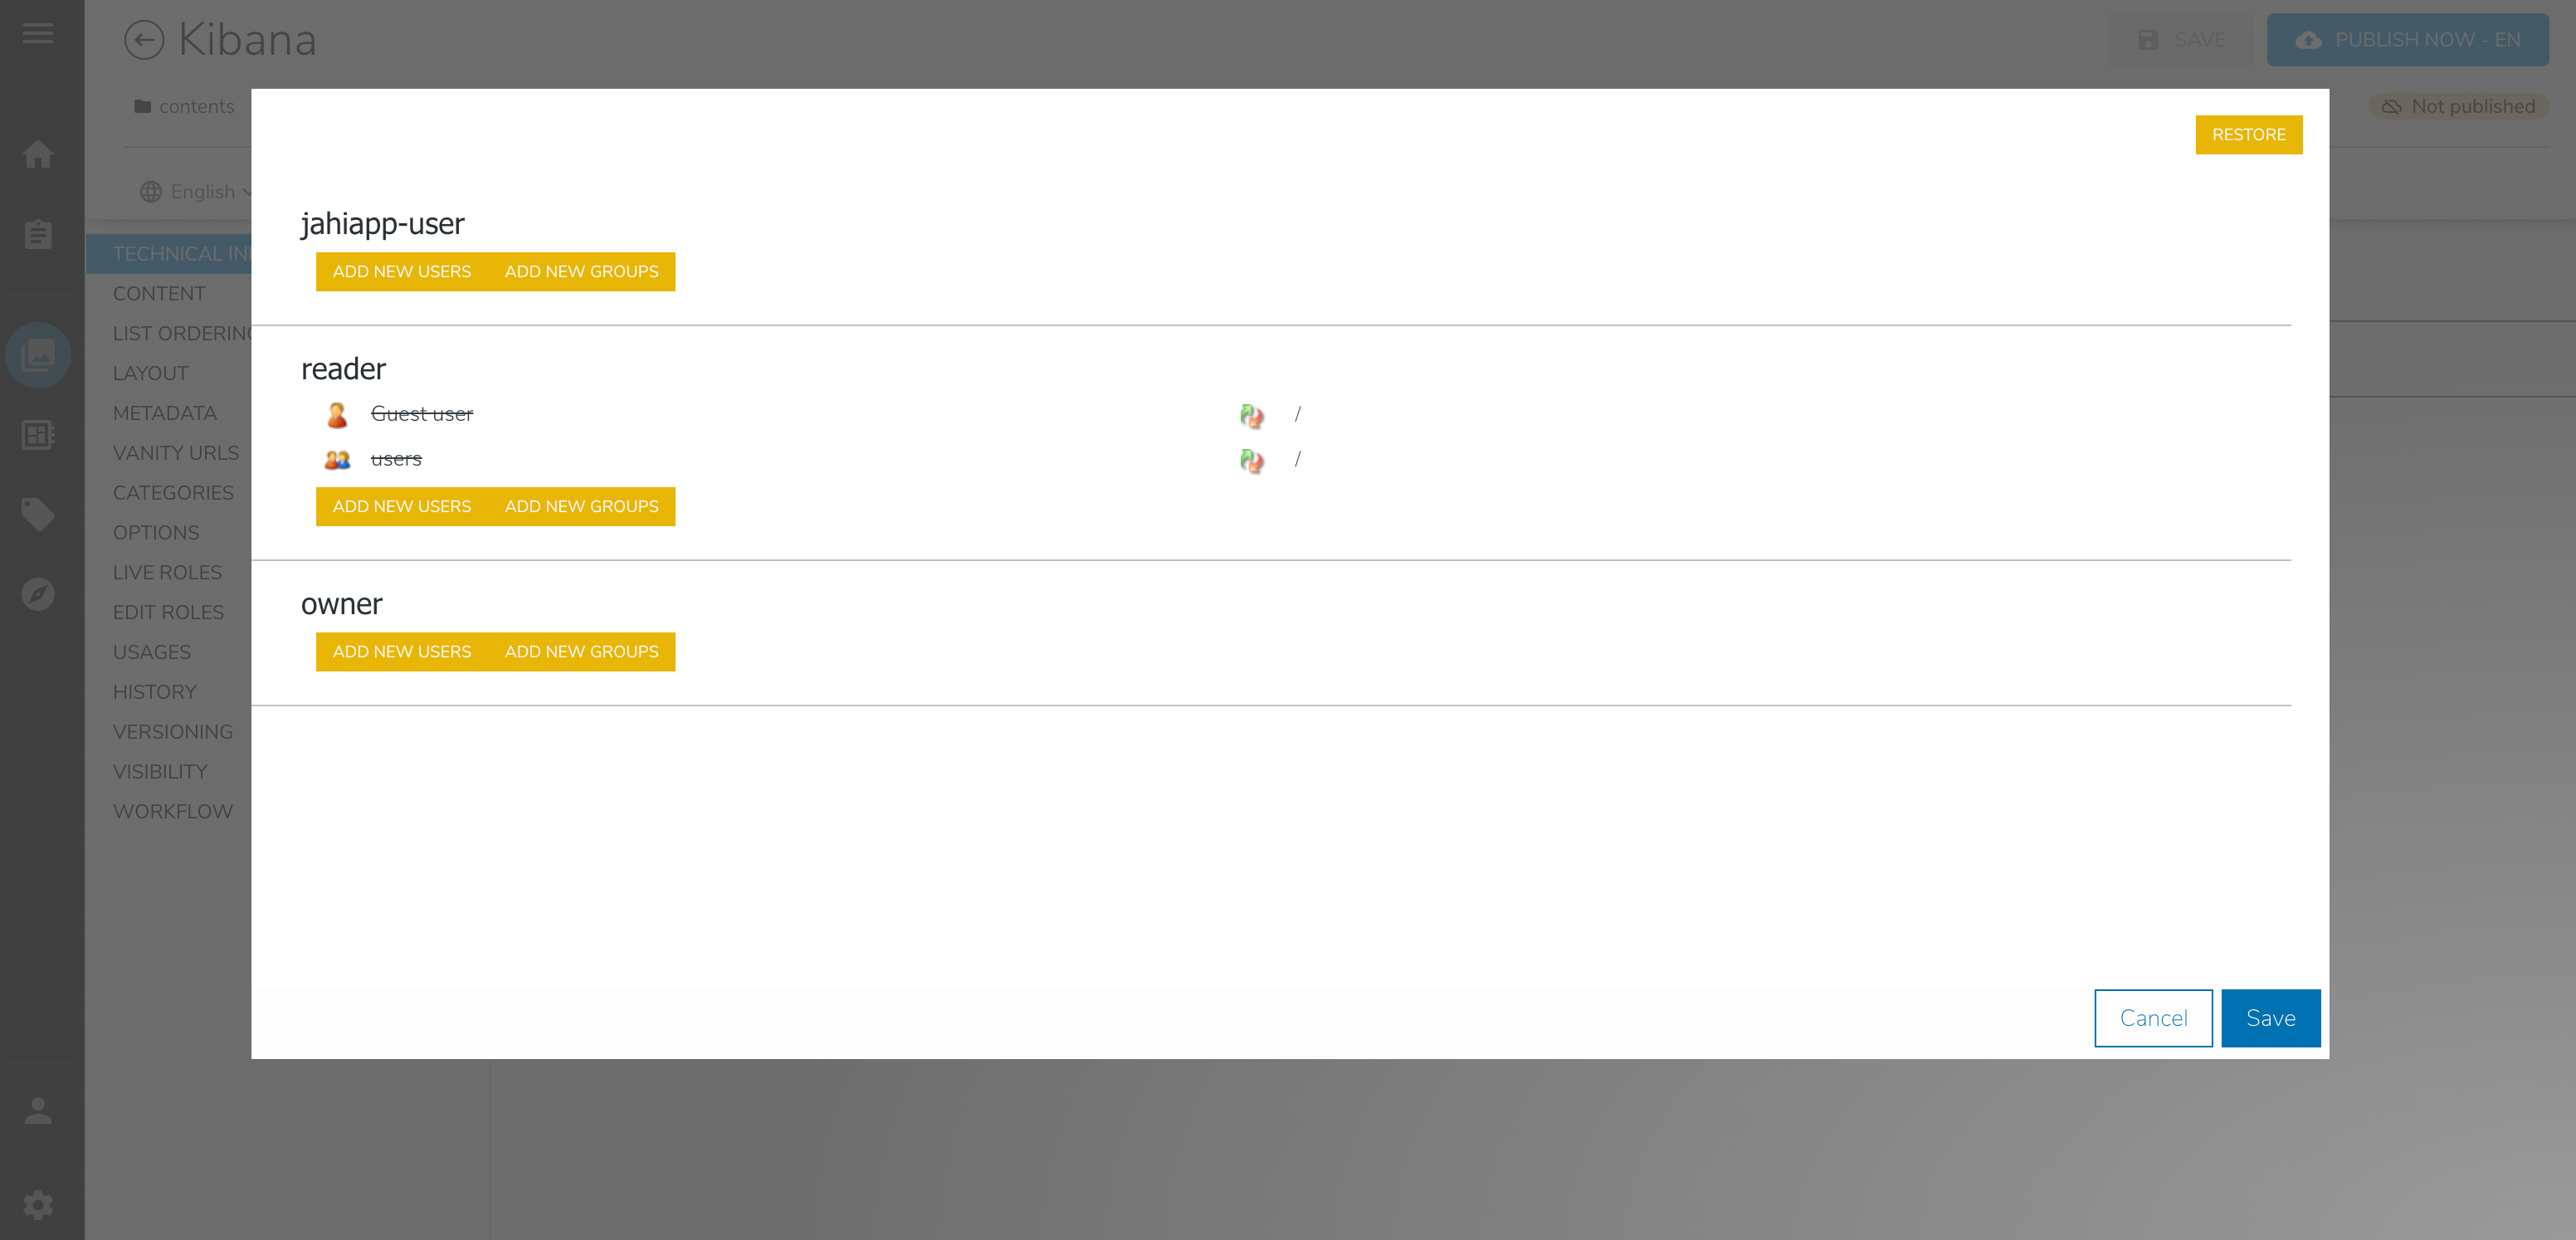
To authorize a group to view the dashboards, add the live role "reader" to this group on the node "/sites/systemsite/contents/kibana". All users or groups with the "reader" role on the node will be authorized to access Kibana Dashboards.
To configure permissions:
- Open jContent, select "System Site", click on "Content Folders" and edit the "kibana" node.
- Select "Advanced Mode", then "Advanced options".
- Add users or groups to the "reader" permissions, by default "Guest user" and "users" are disabled).
This operation is only required the first time the module is installed.
Be cautious if restoring access to "users" or "Guest user":
- Enabling "Guest user" means anyone (including anonymous users) will be able to access the dashboard
- Enabling "users" means any authenticated user will be able to access the dashboard (depending of your implementation, this is not necessarily limited to Jahia content editors)