Editing AB tests
You can select one or more additional variants and define a control variant. To add a variant:
- Click Add variant.
- In Variant name, type a name.
- In Select template, choose a template from the list.
- Click Save.

- Add additional variants as needed.
- To define the control variant, select the check box beside a variant.
- To specify the amount of traffic that is directed to the content or page template:
- Select a variant.
- In Manage traffic, use the slider to change the percentage of traffic to allocate to this variant. You can also enter a numeric value in the percentage field.
- Ensure that the total traffic allocation of the variants is 100%.

- To limit the duration of the test, do one of the following:
Note: By default, an AB test starts running when you save it.- Choose a start and end date for the test.
- Set a maximum number of hits for the test. When the goal of the AB test has been converted more times than the maximum number of hits, the test stops. To disable the maximum number of hits, set the value to 0.

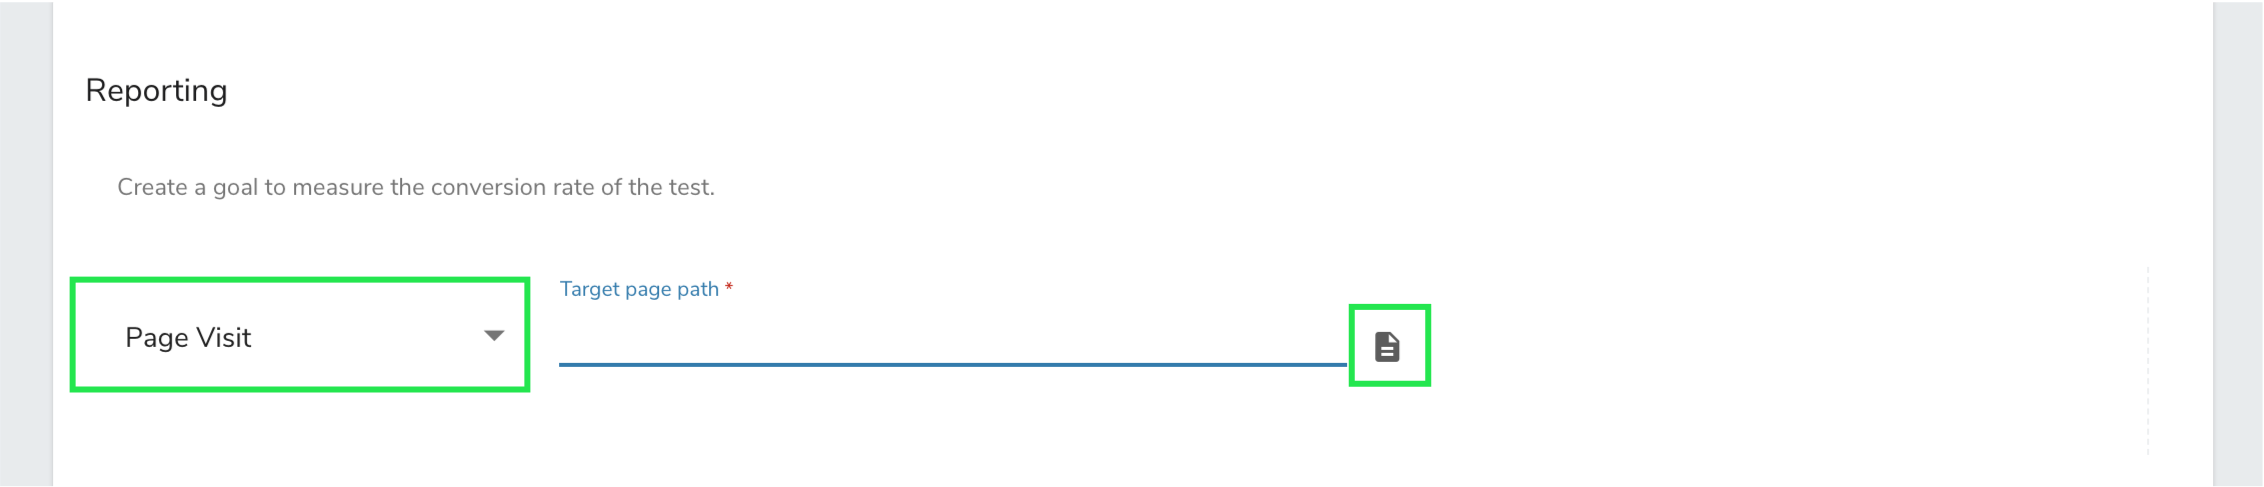
- To compare the performance across your variations, you must setup a goal. The only goal type available is page visit.
- Set the goal type to page visit.
- Select the page that you want to use as your goal page.
Viewing AB test reports
You can view reporting information for AB test that are running. The report page displays the AB test goal chart at the left of the page, the Variant - quantitative chart at the right of the page, and Goal info at the bottom of the page.
The AB test goal report displays the total views and conversion rates for all variants in your AB test. In the report, the numbers at the top of the chart indicate the total number of views for all variants and the total number of conversion variants. In the example, the variant has been viewed 24 times and has had 8 conversions. The report also displays conversion rate of visitors in chart and numeric format.

The Variant - quantitative chart at the right shows the number of conversion by date. You can change what displays in the chart by modifying the chart's date and other settings. Data also displays below the chart in a table.
The Goal info section displays the goal type, name, and description and the path to the target page for the test.

Changing the chart display date
You can use the date picker at the top of the Variant - quantitative chart to change the date range for data that displays in the chart and datatable. You can can select a date range, such as 3 month, or select Custom to specify a custom date range.

Changing the chart display type
You can change the information that displays in the Variant - quantitative chart in the following ways:
- To show the total number of conversions by date, select Change to performance chart
 . To show the conversions rate by date, select Change to quantitative chart
  .
. - To view data as a line chart, select Change to line chart
 . To view data as a bar chart, select Change to bar chart
  .
. - To show or hide a variant on the chart, click on a variant name below the chart. For example, hide a variant to focus on other variants in the report.

Viewing AB test data in a table
You can view AB test data in the table below the chart. By default, the table contains the following columns:
- Number of times the variant was viewed
- Number of conversions after the variant was viewed by a site visitor
- The conversion rate of the variant as a percentage

You can sort data in columns in ascending or descending data by clicking the arrow button at the top of a column.
Filtering the chart
In the table, you can select a variant to display more information about the variant in the chart and table. For example, to focus on the performance of a specific variant select the variant.

The chart and table then displays new information. The chart now displays the conversion rate details by segment for the selected variant.
