Monitoring the health of your system
Jahia DX Healthcheck probe
The Healthcheck module provides insights about a platform's health and can help trigger alerts or pay attention to key components that might need close attention. Jahia's Healthcheck module provides a JSON output and it can be triggered at will with minimal impact on the platform load.
The healthcheck module is a core component that can be used in conjunction with extension modules in order to provide more information to the monitoring systems.
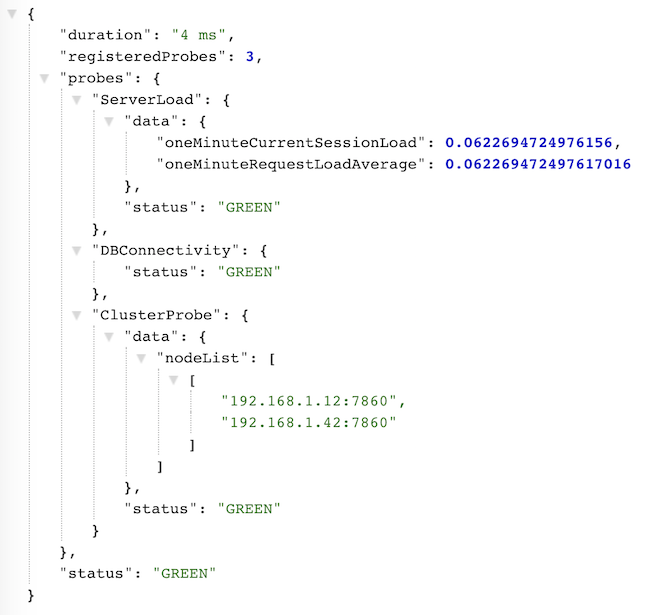
The healthcheck module returns a global status for the server, as well a status for all tested components. The status can be:
- GREEN (Nominal status)
- YELLOW (Non critical problem)
- RED (Critical issue)
Usage
The healthcheck is available through the servlet /healthcheck to all users who are granted the Jahia DX server role monitoring It returns a JSON object with the following structure:
Prerequisite
The Healthcheck module works on any Jahia DX 7.2.0.2+ platform.
Authentication
The healthcheck permission deployed on the /sites/systemsite is necessary for someone to access the healthcheck servlet. Otherwise, a permission denied message is returned.
Alternatively, a token system was introduced in version 1.0.9, where it is no longer necessary to be identified. Tokens can be generated in administration mode.
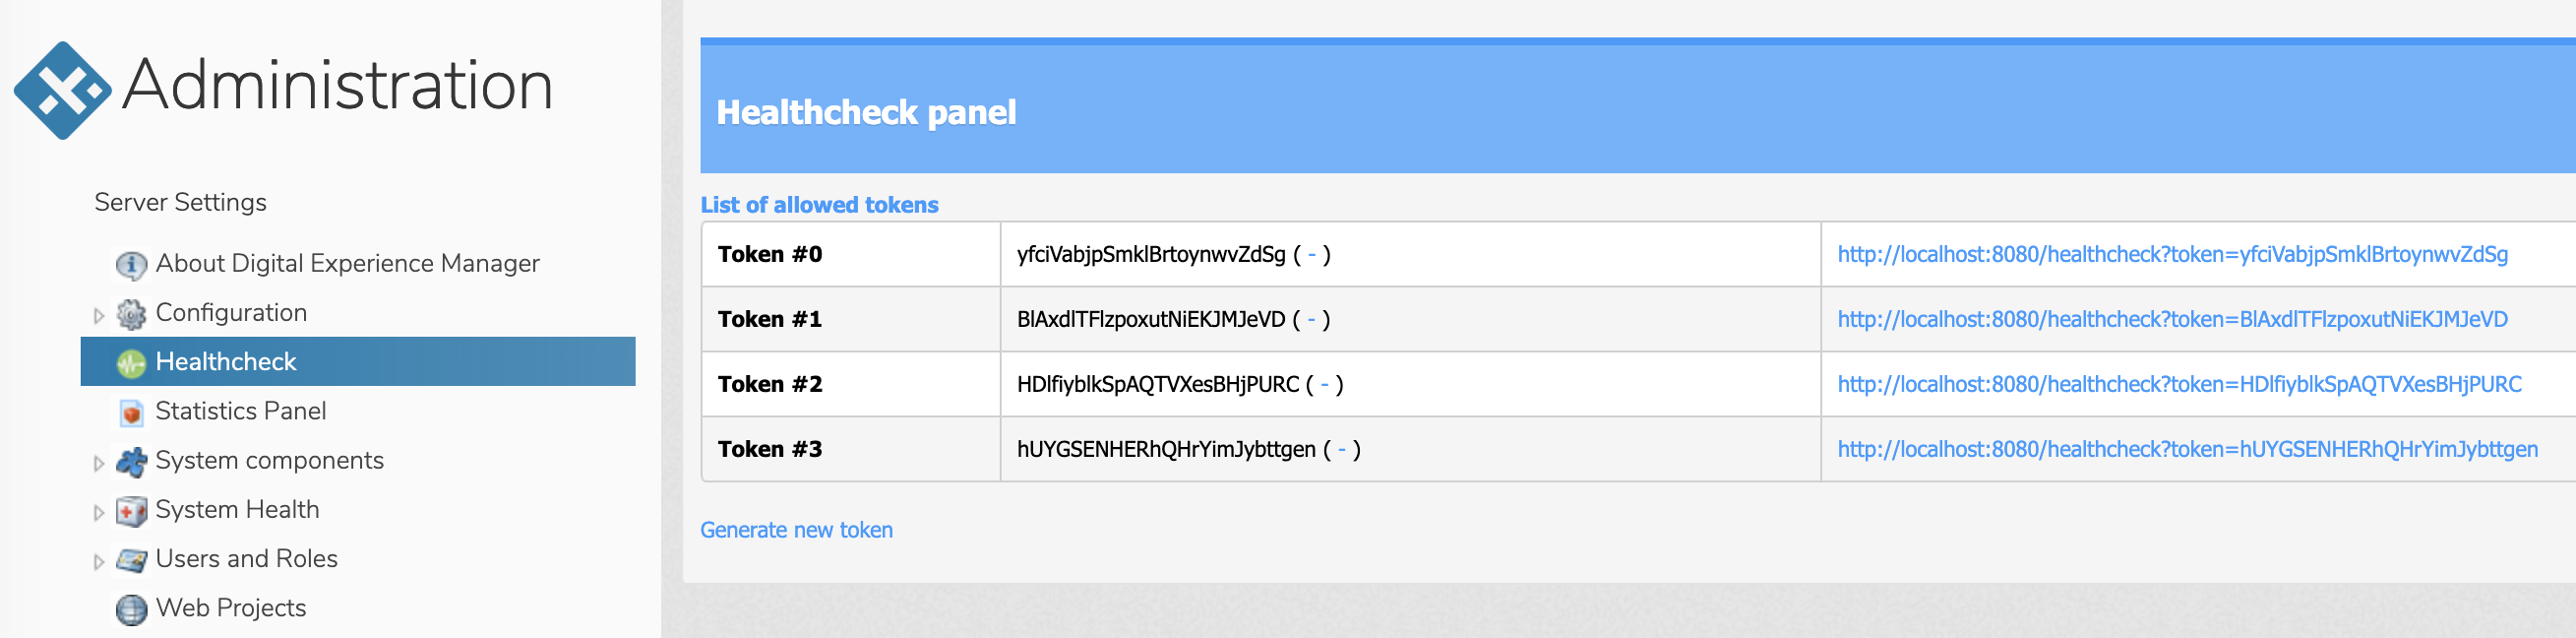
Tokens need to be passed as a GET parameter to the healthcheck servlet, under the token parameter. Tokens can be added and revoked on the fly.
Extensions
While the core healthcheck provide basic capabilities such as database connectivity and server load checks, additional modules can extend its capabilities. When deploying a proper healthcheck module extension, the healthcheck servlet will automatically be added with the new information.
A typical Healthcheck extension is the healcheck-cluster module.
Custom extensions
Developping a custom extension is straightforward and can be done in two different ways:
Forking the healcheck-extensionexample module (https://github.com/Jahia/healcheck-extensionexample)
Manually declarating an OSGi service and implementing a Java interface (described bellow)
Steps to creating a Healthcheck extension:
1. Updating the pom.xml file
Add the following elements to the pom file:
<dependencies>
    <dependency>
        <groupId>org.jahia.modules</groupId>
        <artifactId>healthcheck</artifactId>
        <version>[1.0,2.0]</version>
        <scope>provided</scope>
    </dependency>
</dependencies>

<properties>
    <jahia-depends>default</jahia-depends>
    <jahia-module-type>system</jahia-module-type>
    <import-package>org.jahia.modules.healthcheck.interfaces</import-package>
</properties>

<build>
    <plugins>
        <plugin>
            <groupId>org.apache.felix</groupId>
            <artifactId>maven-bundle-plugin</artifactId>
            <extensions>true</extensions>
            <configuration>
                <instructions>
                    <Jahia-Depends>default, healthcheck</Jahia-Depends>
                    <_dsannotations>*</_dsannotations>
                </instructions>
            </configuration>
        </plugin>
    </plugins>
</build>
2. Create a new Java Class
In the extensionexample module, we decided to create a org.jahia.modules.healthcheckexample.probes package and a ProbeExample.java file.
3. Create a Probe OSGi service
In the Java Class previously created, implement the Probe interface (org.jahia.modules.healthcheck.interfaces.Probe) and declare a new Probe service:
import org.osgi.service.component.annotations.Component;
import org.jahia.modules.healthcheck.interfaces.Probe;

@Component(service = Probe.class, immediate = true)
public class ProbeExampleService implements Probe {
   ...
}
Then, implement all 3 methods:
@Override
public String getStatus() {
    ...
    return "GREEN";
}

@Override
public JSONObject getData() {
    // Contains potential error messages. Return null if no message is necessary
    return jsonObject;
}

@Override
public String getName() {
    return "ProbeExample";
}