Using My Dashboard
1 Introduction
Jahia Digital Experience Manager is a platform for managing a variety of digital initiatives in a productive and secure fashion. Initiatives such as building websites, mobile sites, intranets and portals, all of which can interact with visitors in order to deliver the best user experience possible.
This document introduces new users to the Jahia Digital Experience Manager platform, from accessing the system to learning their way around the personalized interface called The User Dashboard.
The User Dashboard described in this document is the default Digital Experience Manager User Dashboard. Please note that it is possible to customize the User Dashboard through development. Should you encounter features not covered in this document please ask your administrator to provide you with the documentation specific to your project or organization.
The User Dashboard is an interface available for registered Digital Experience Manager users who have writing privileges on the staging version of the content. Other registered users who are not allowed to edit content on the platform (like authenticated visitors, forum user, etc.) won’t be able to access this interface. In other words, the User Dashboard is an internal Digital Experience Manager tool for editors and a good starting point to the application.

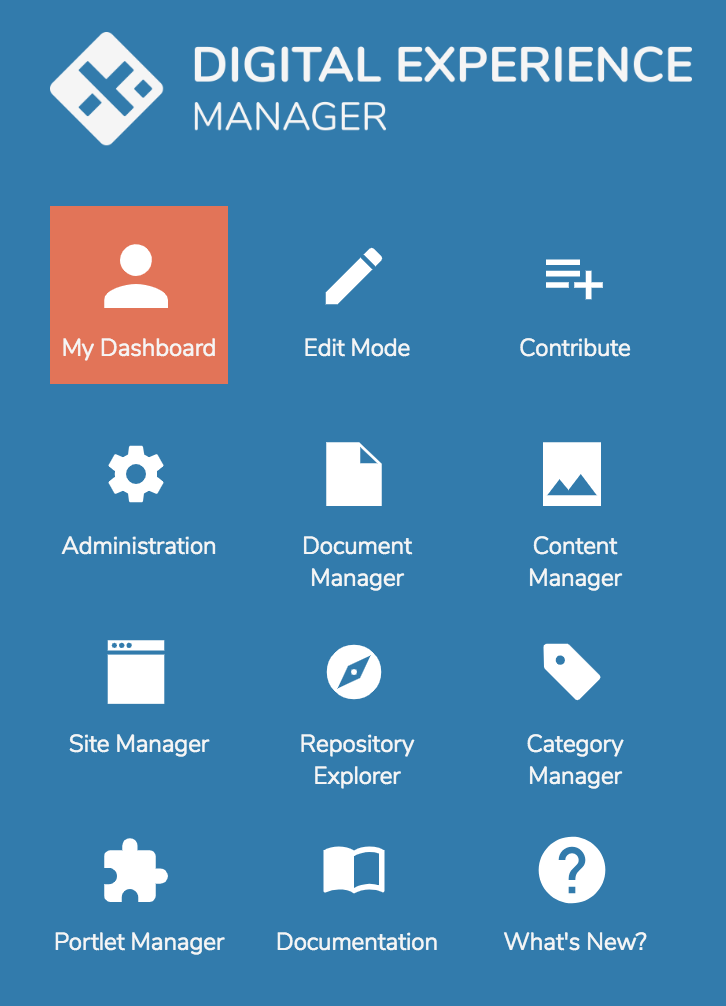
Returning to the User Dashboard is possible at any time in Contribute Mode, Edit Mode and Studio by using the DX Menu. This icon leads to the general Digital Experience Manager screen where the "My Dashboard" is available.
The user dashboard is composed of two parts
- a menu on the left displaying available features of the dashboard itself.
- a central part where the selected item in the left menu is displayed in details
There are 5 entries in the dashboard menu by default with Digital Experience Manager 7.2.2
- My Files
- My Settings
- My Pages
- My Web Projects
- My Tasks
Note that developers can extend the Dashboard by adding new entries / features. A document explains how to create new panels, knowing that it is the same mechanism to extend the dashboard, the server administration UI or the Site settings UI.
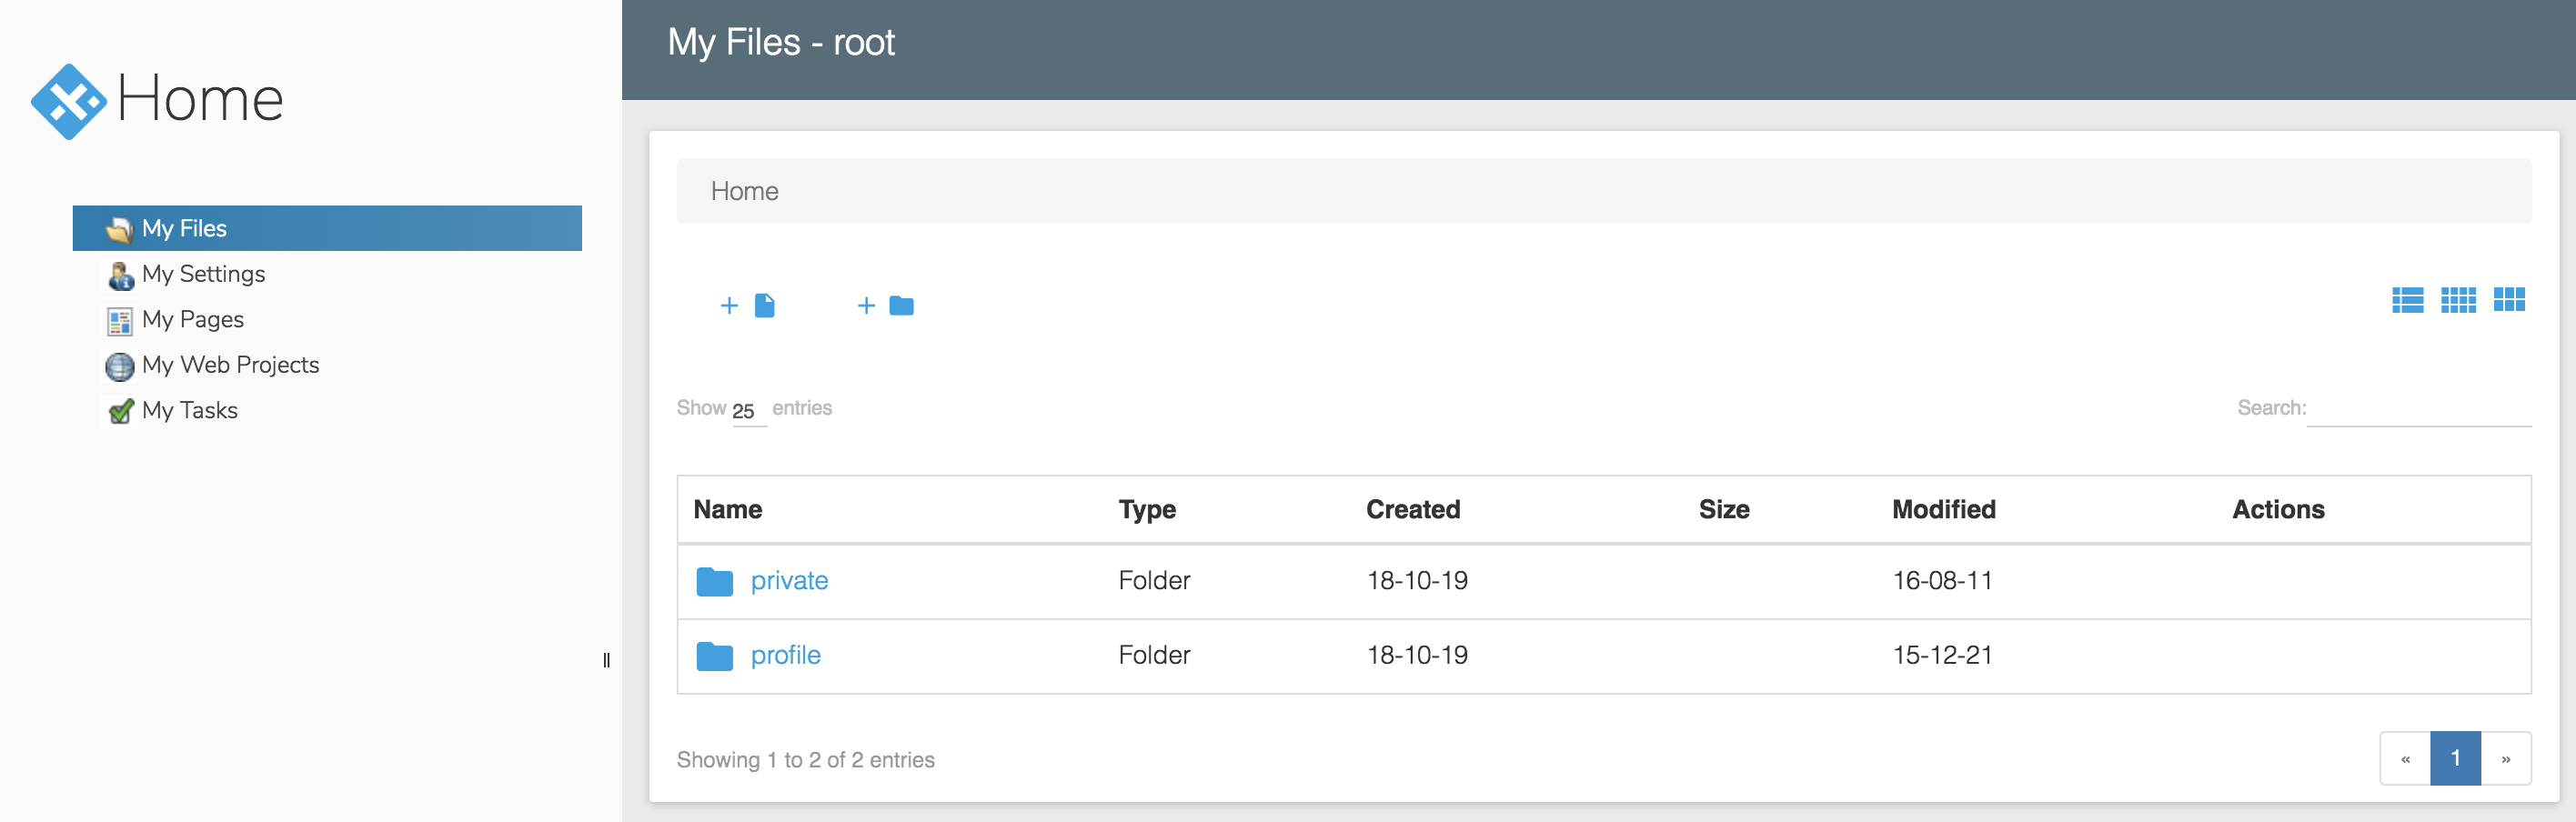
2 My Files
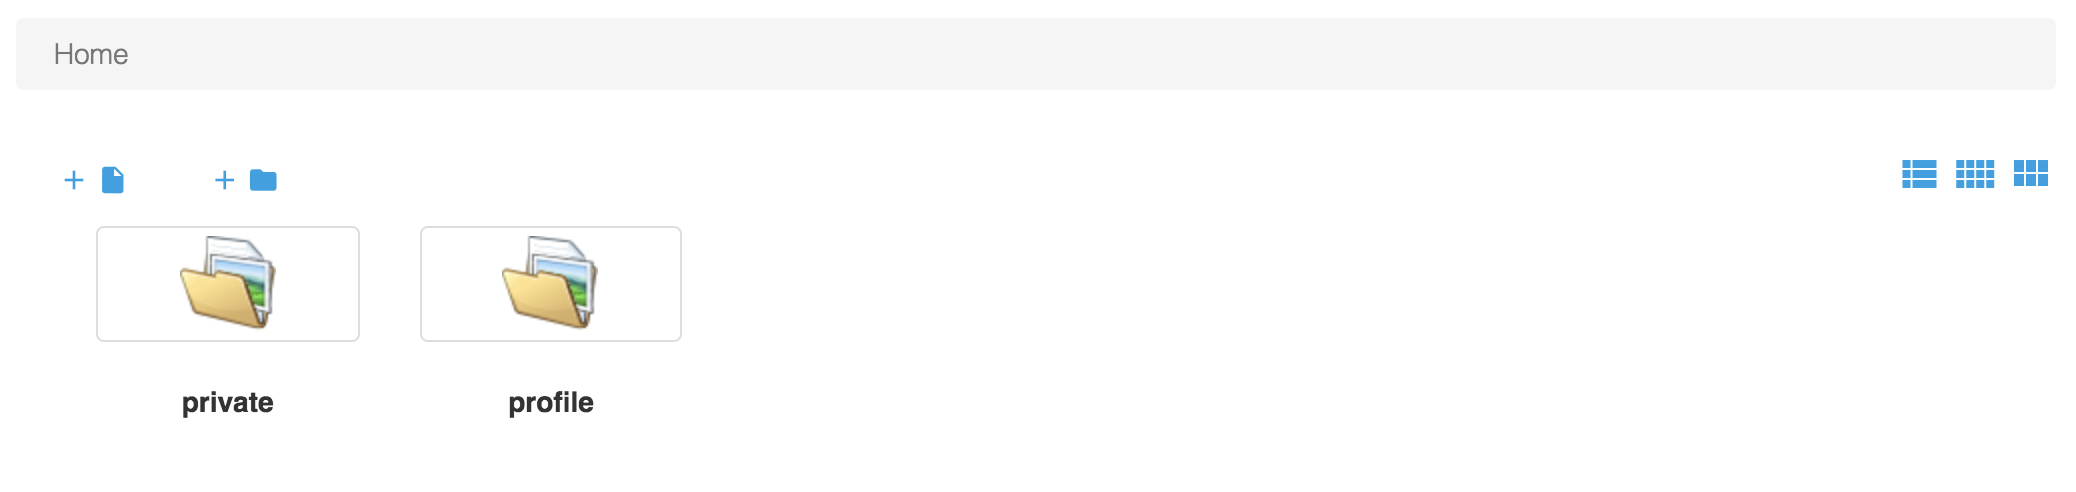
This panel displays the list of files stored in the user personal directory. Under the file directory two subfolders are created by default
private: files and folders stored under this folder cannot be seen by anyone but the userprofile: this folder contains only the picture of the user
All files placed in the user repository but not in the “private” folder can be read by other users. The files located in the user directory can then be used inside pages of the various websites on the platform and will be seen by visitors.
Using the icons 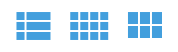
List : this is the default one; A list of files, with some details for each file, like creation date, modification date, size.

Thumbs : items are displayed by their thumbnails
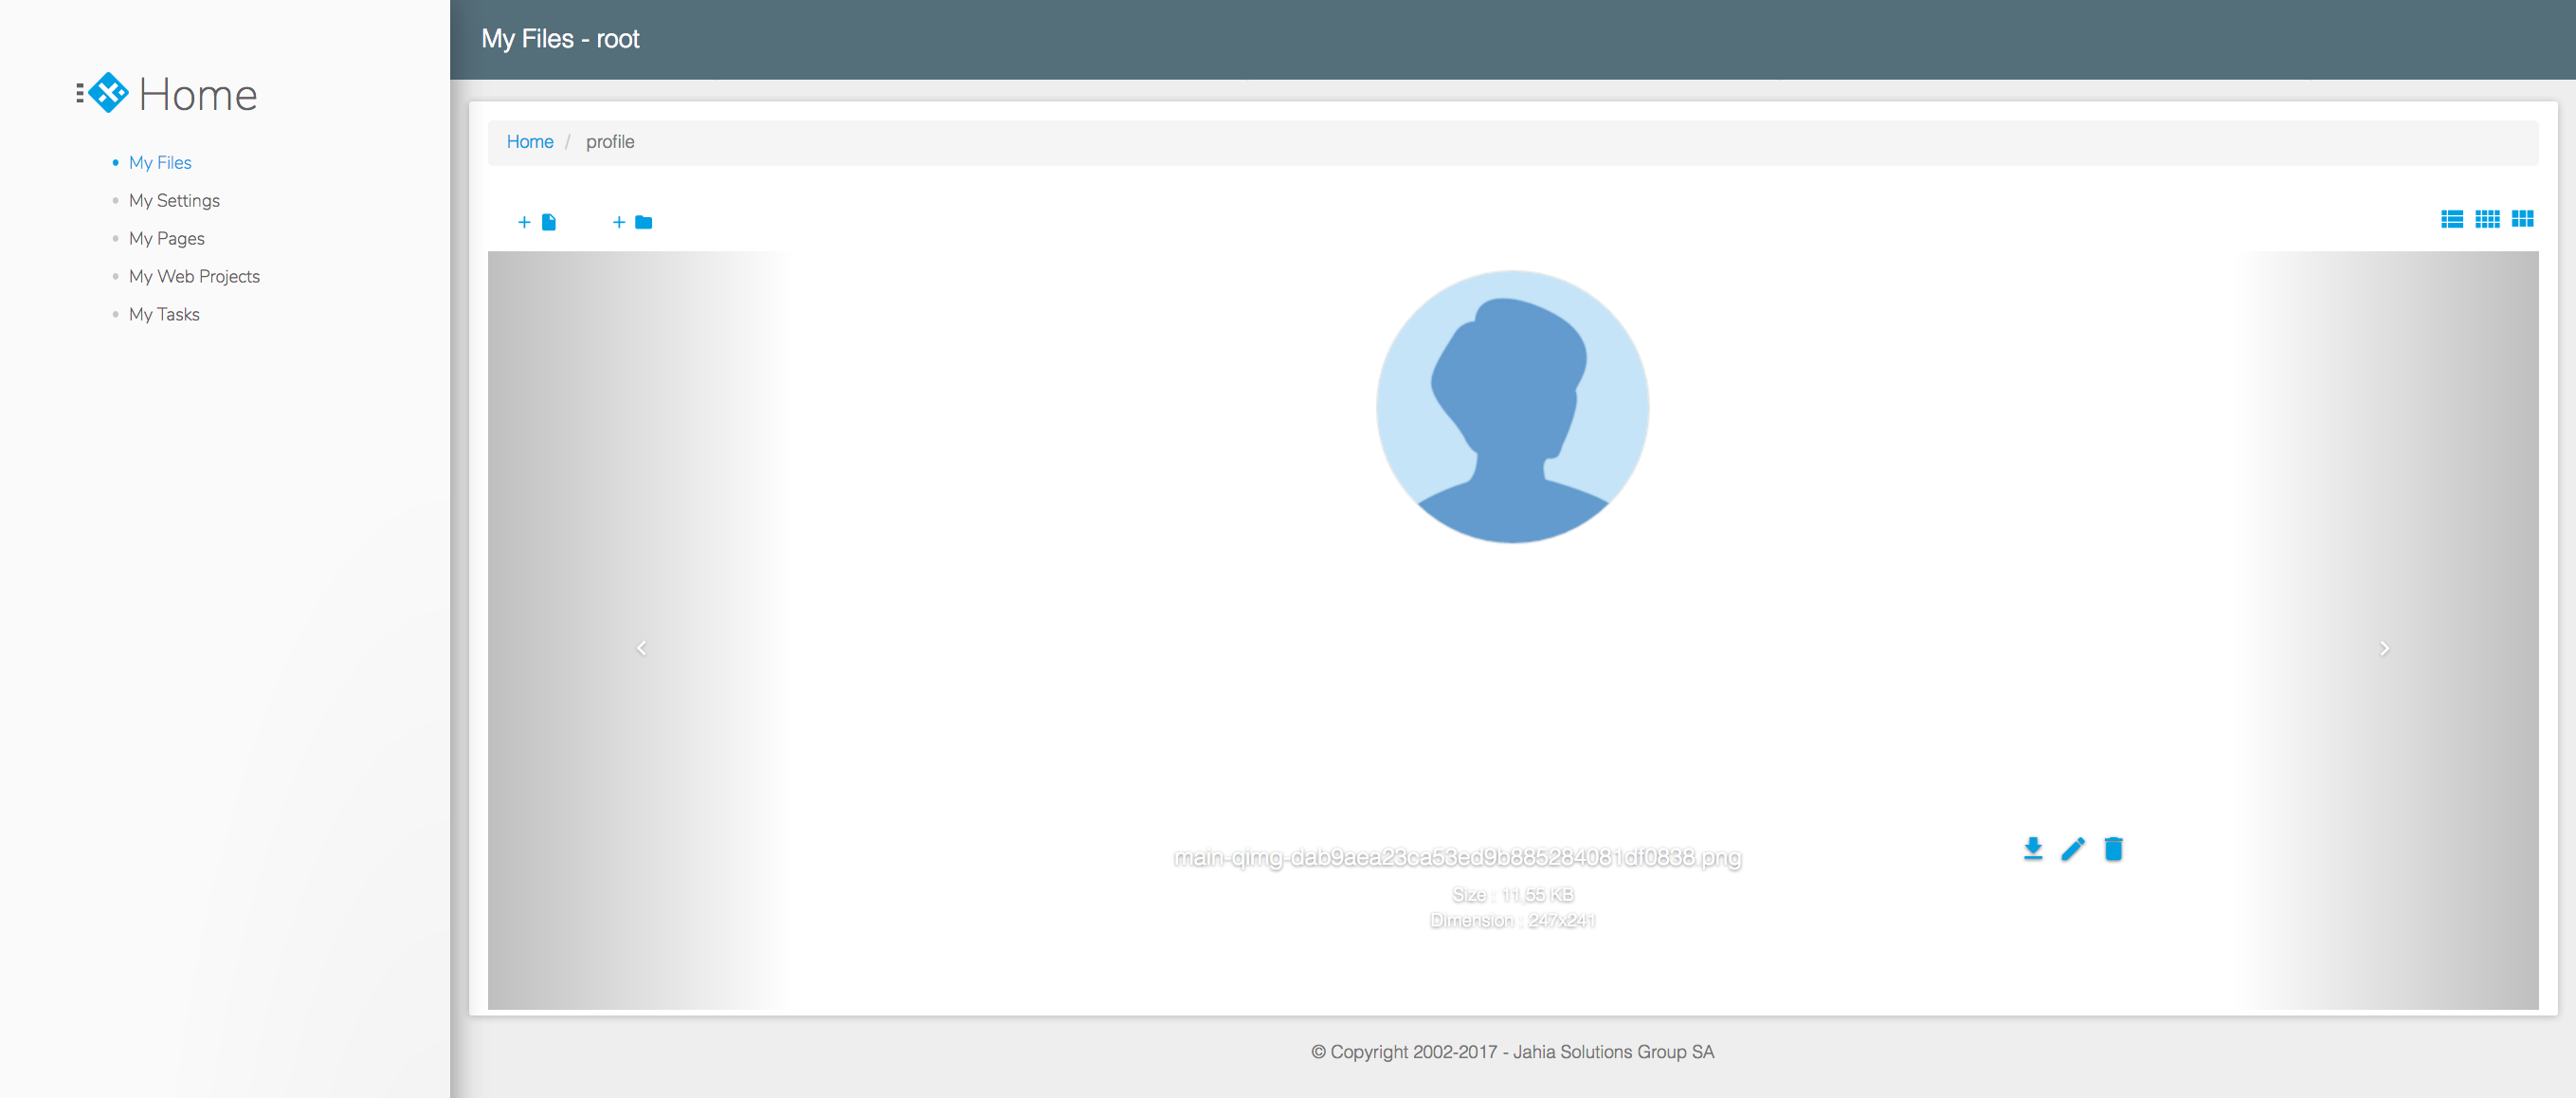
Slider: items are presented one by one in a greatest size (full size when possible) with arrows to navigate to the next or previous item.
Whatever the layout three operations are always possible on each file, symbolized by the following icons
- download the file
- rename the file
- delete the file
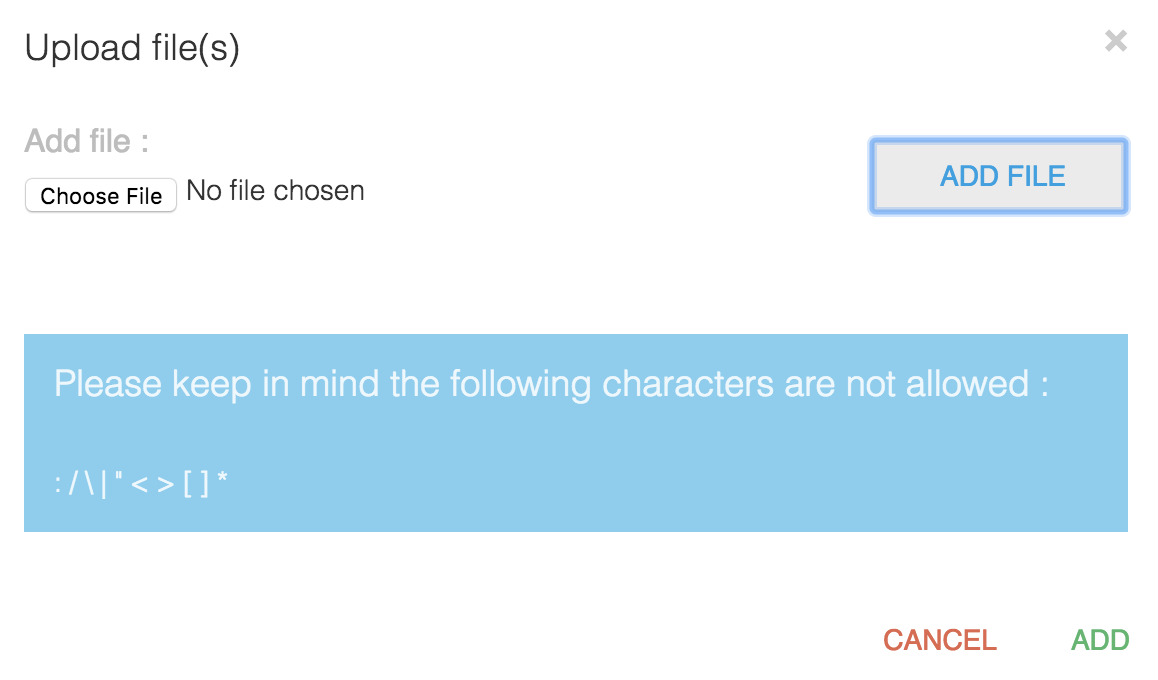
To upload a file, click on the 
To create a new folder, click on the 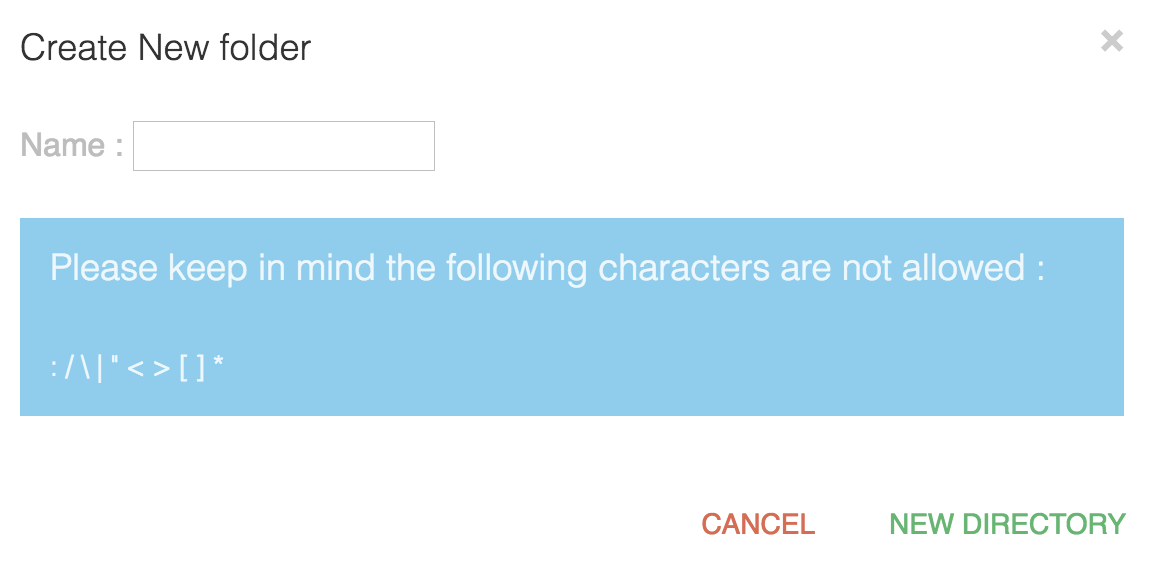

To navigate in the folders hierarchy, click on a folder name in the list layout or thumbs layout. You can go back in the hierarchy thanks to the path that appears atop of the files

You can also return at any time to the root folder of the files just by clicking on “My Files” in the menu of the User Dashboard.
3 My Settings
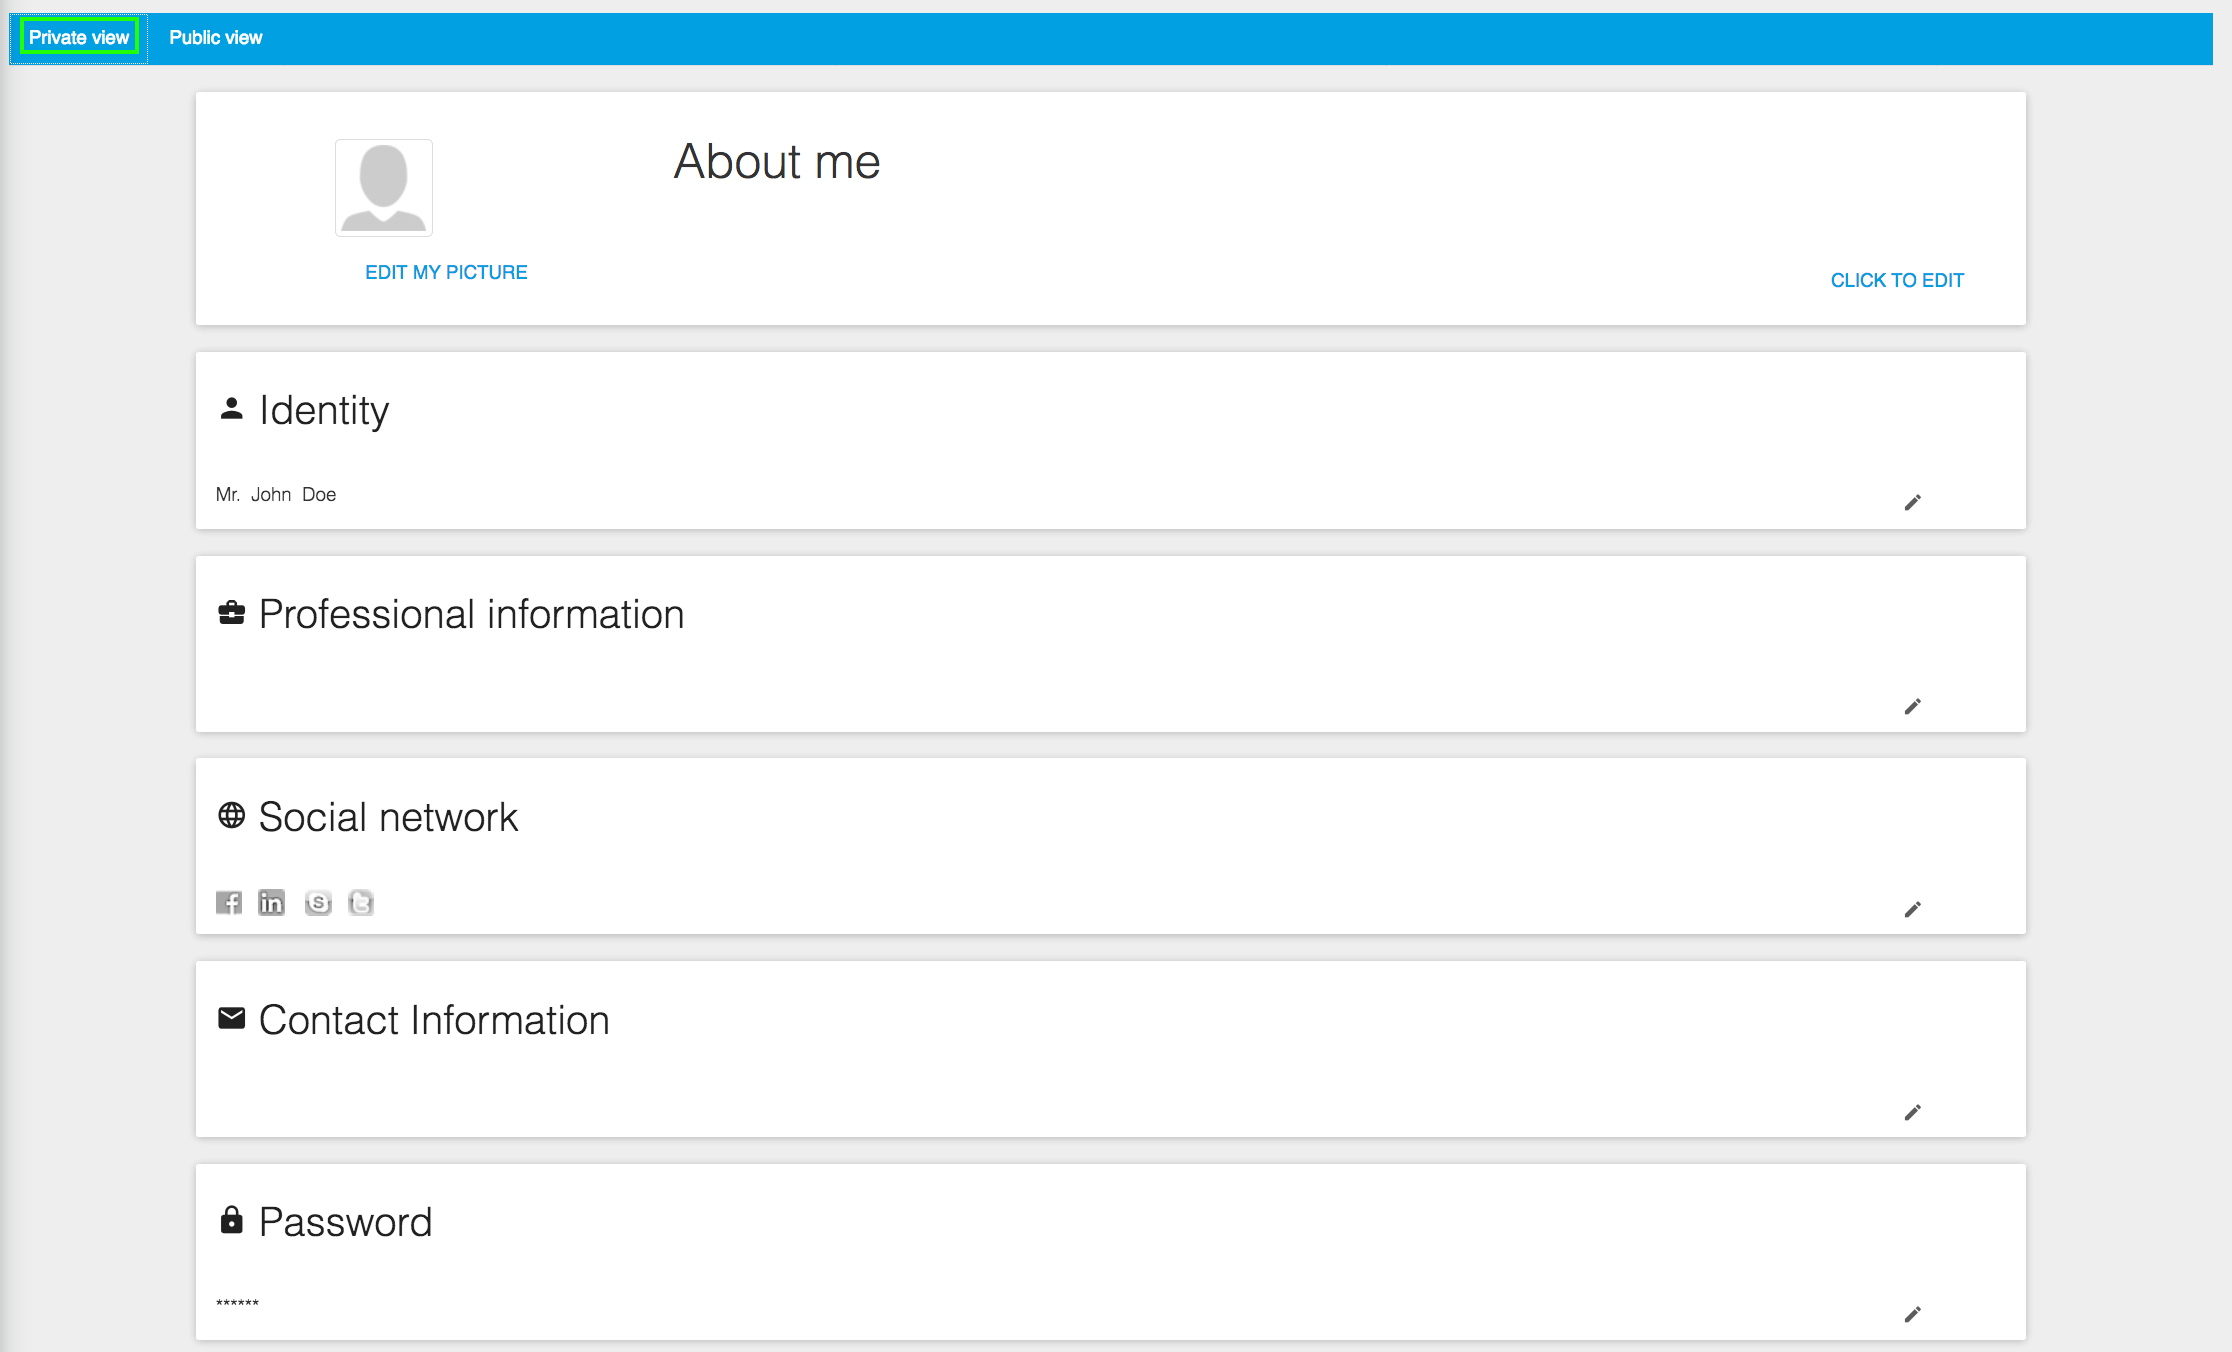
This panel allows users to fill their profile information. It is divided in several sections to ease the edition.
- Portrait and presentation (about me): your photo (or avatar) and a text area to present yourself
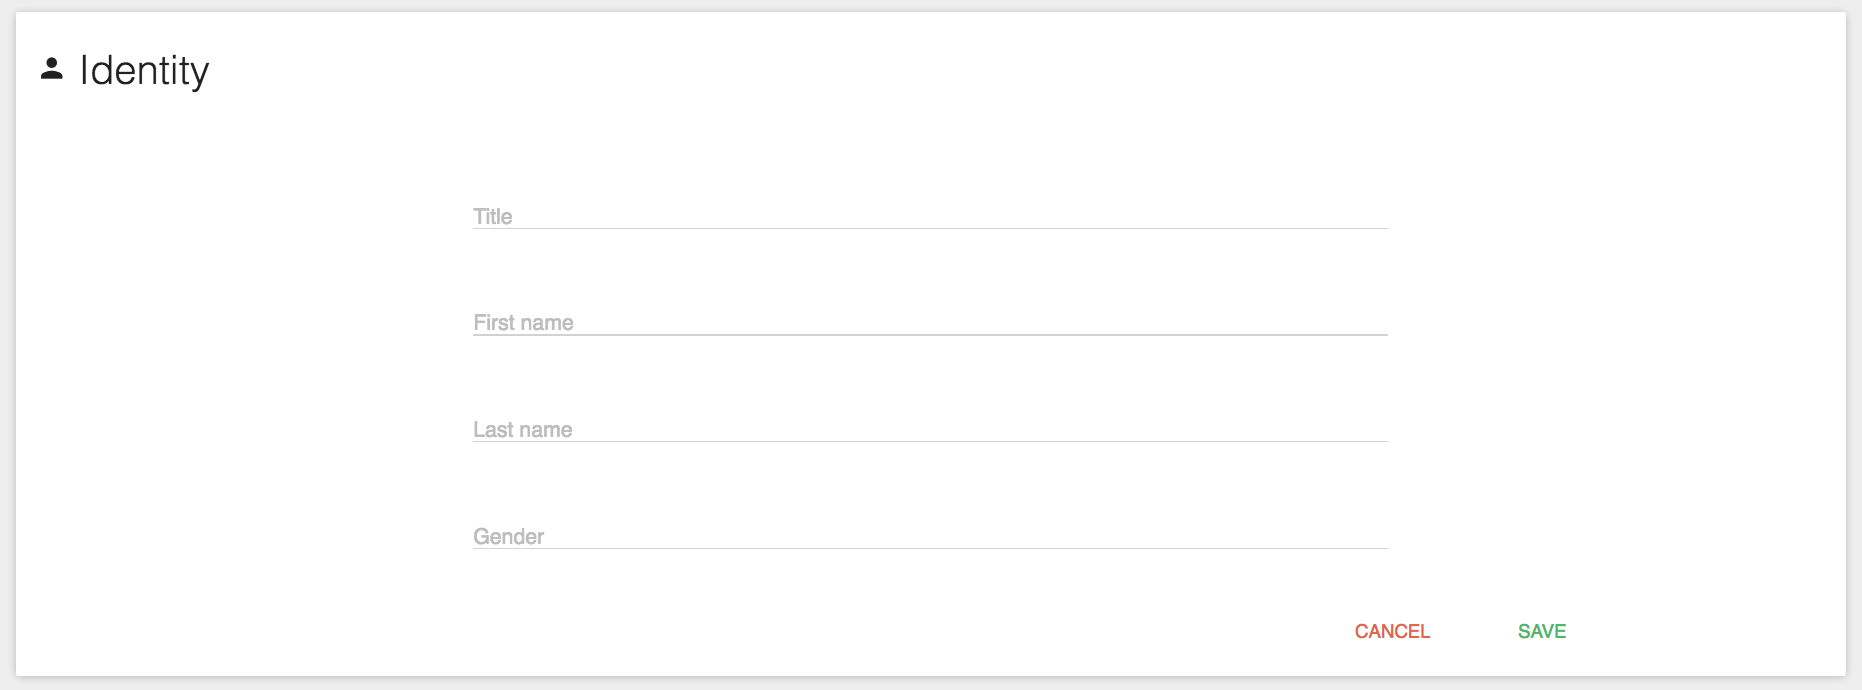
- Identity: classical information like name, title, etc.
- Professional information: your position and the organization you work for
- Social network: your API key for various social networks
- Contact information: your address and phone contact information
- Password: allows to change your password
- Other information: your preferred language and your birthdate
- Privacy settings: the section where you control what profile information are public or remains private
3.1 Updating your profile
To enter or update the values of a particular section, click on the 
Fill the form then save.
The section appears updated
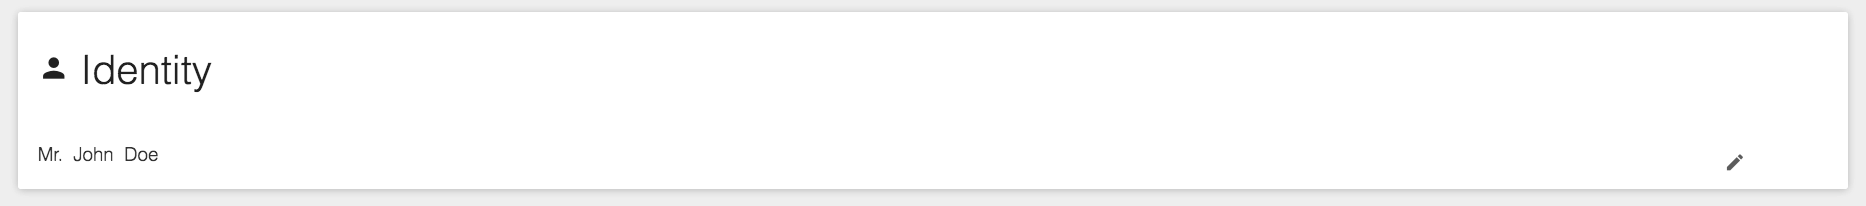
The principle is the same for all sections.
3.2 Controlling the privacy
By default all properties are private. To decide what properties are public (visible by other users of the system), use the last section of the page “Privacy settings”, click on the
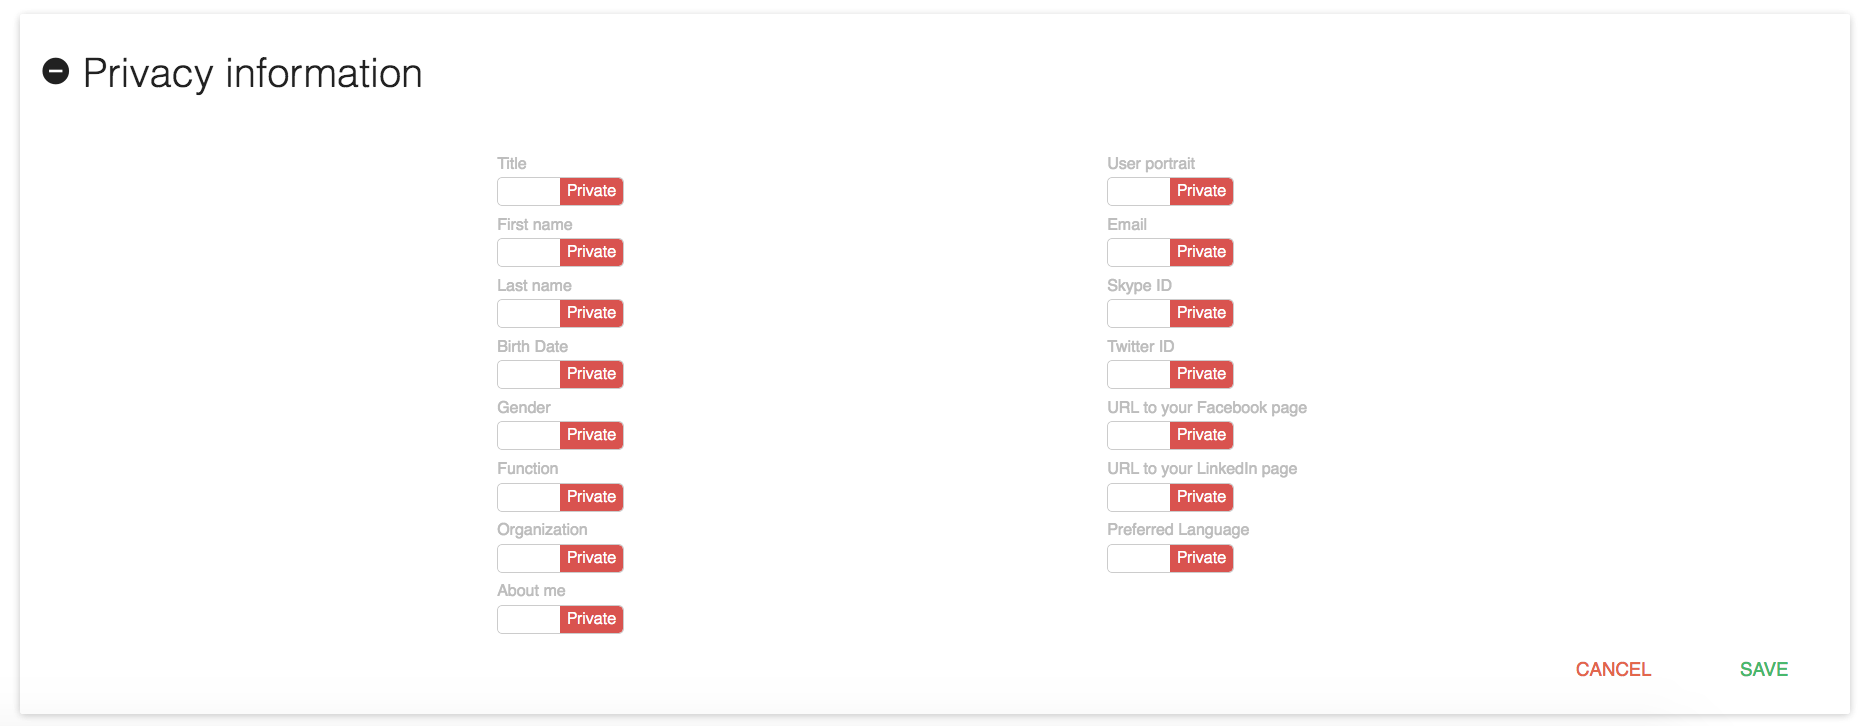
Click on the button to turn the privacy to public (green).

Click on the save button, the section is updated and refreshed
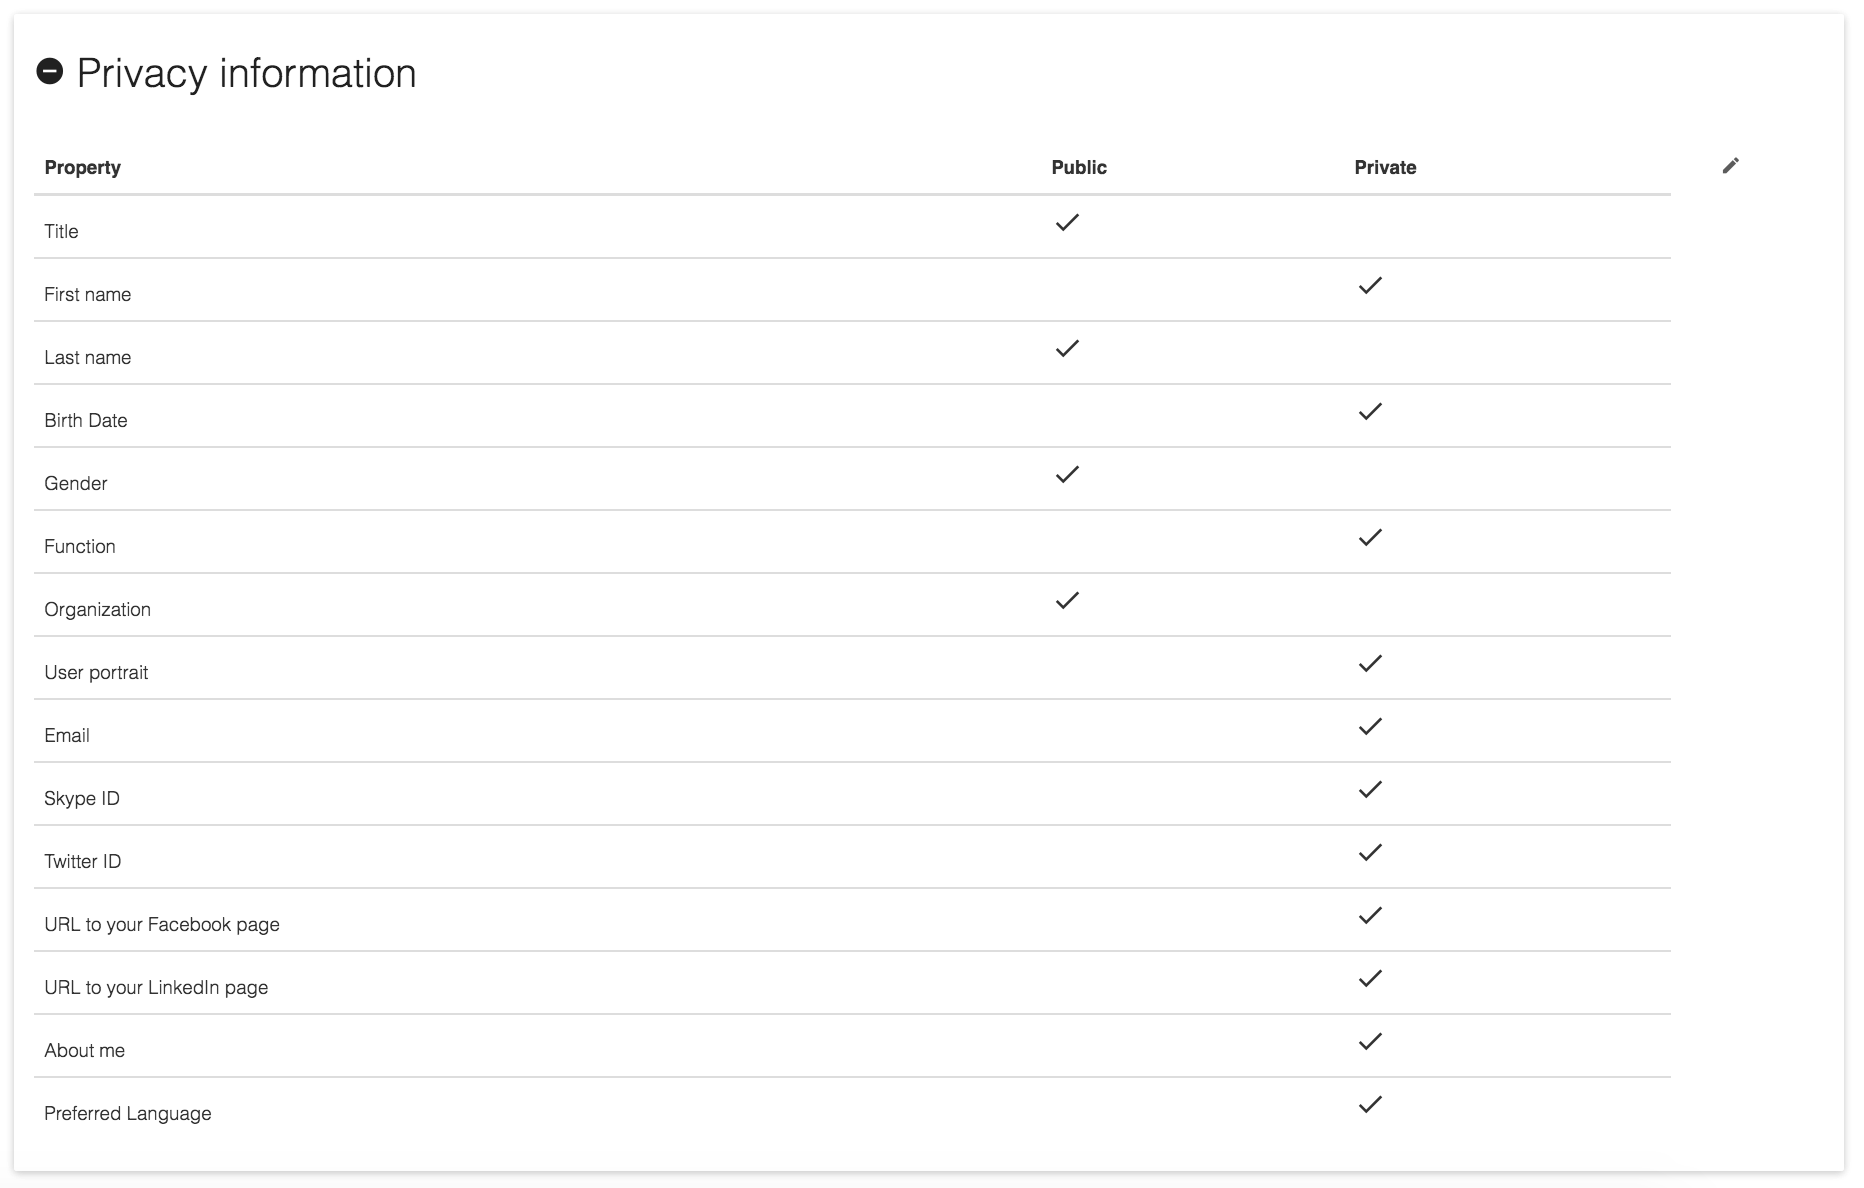
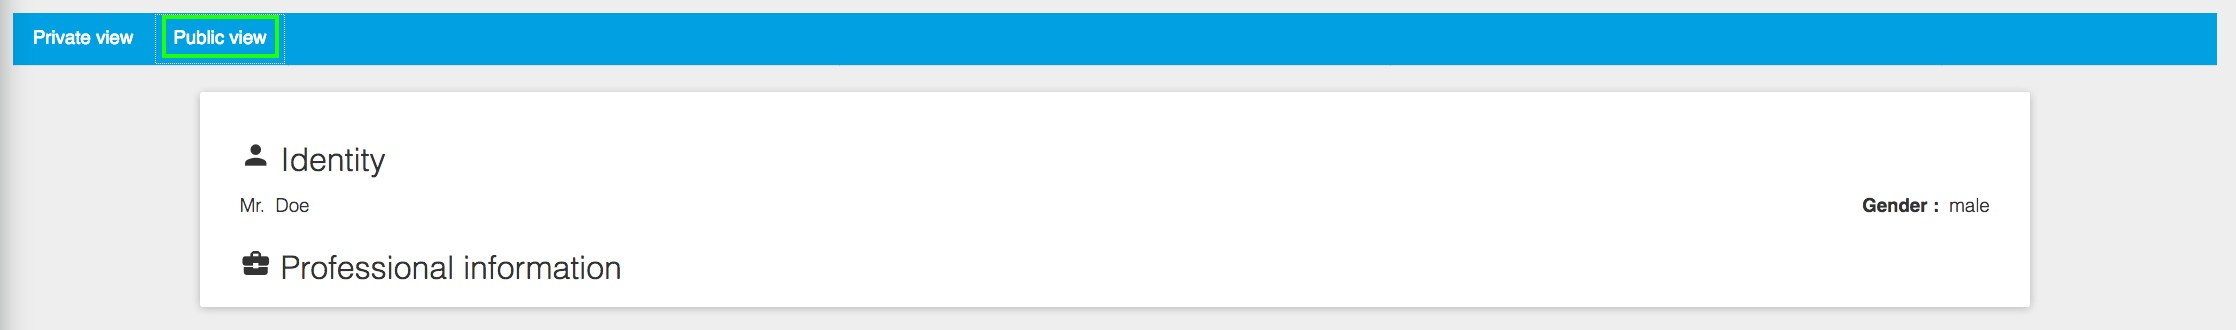
Thanks to the tabs located at the top of the screen, the user profile can be viewed in “private view” meaning that all properties are visible and editable by the user, and in “public view” showing simply what properties from the user profile other users can see.
This “public view” is very handy after changing the privacy settings to control that they correspond to your wills.
4 My Pages
This panel list all the pages created, modified or published by the user. By default the list is ordered by last modification date (the most recent changes first) but can be reordered by clicking on the column headers. Note that this reordering is done on the fly and is not persistent: if the user leave the page and comes back on it, the default sorting will be applied.
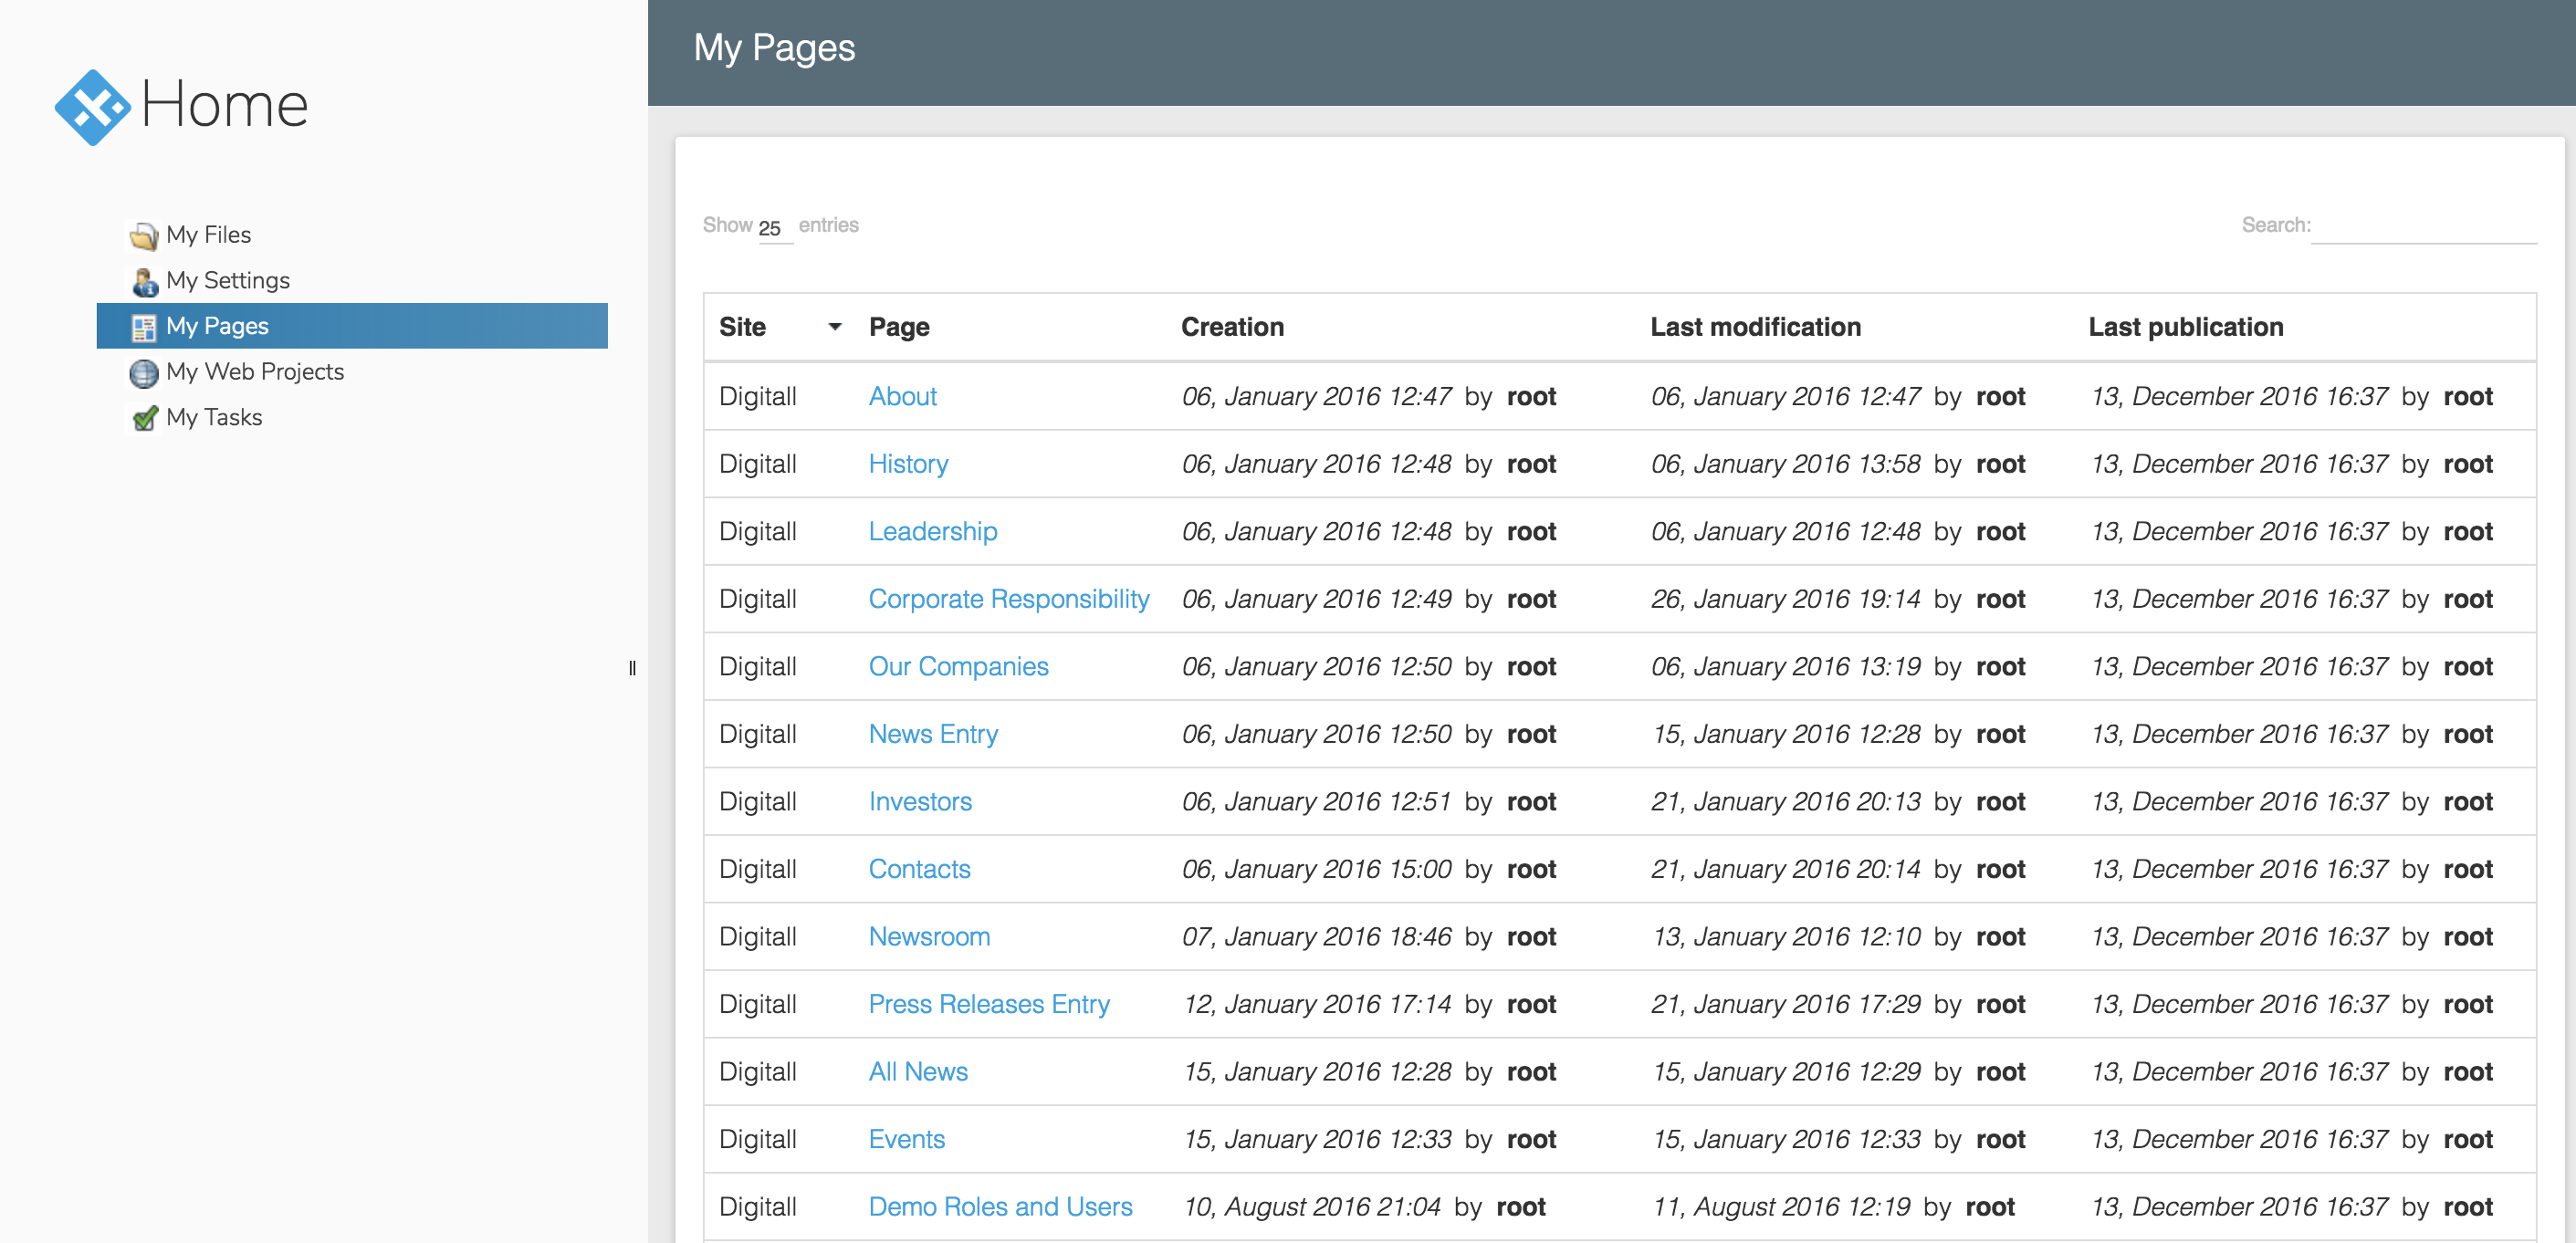
If you click on a page name, you’ll be redirected to that page in Edit Mode directly.
5 My Web Projects
This panel lists all the web projects the user has access-to, depending on his role(s) on the different projects.
On a brand new installation, this screen is empty. When one or several projects exist on the platform, each one appears on a single line.
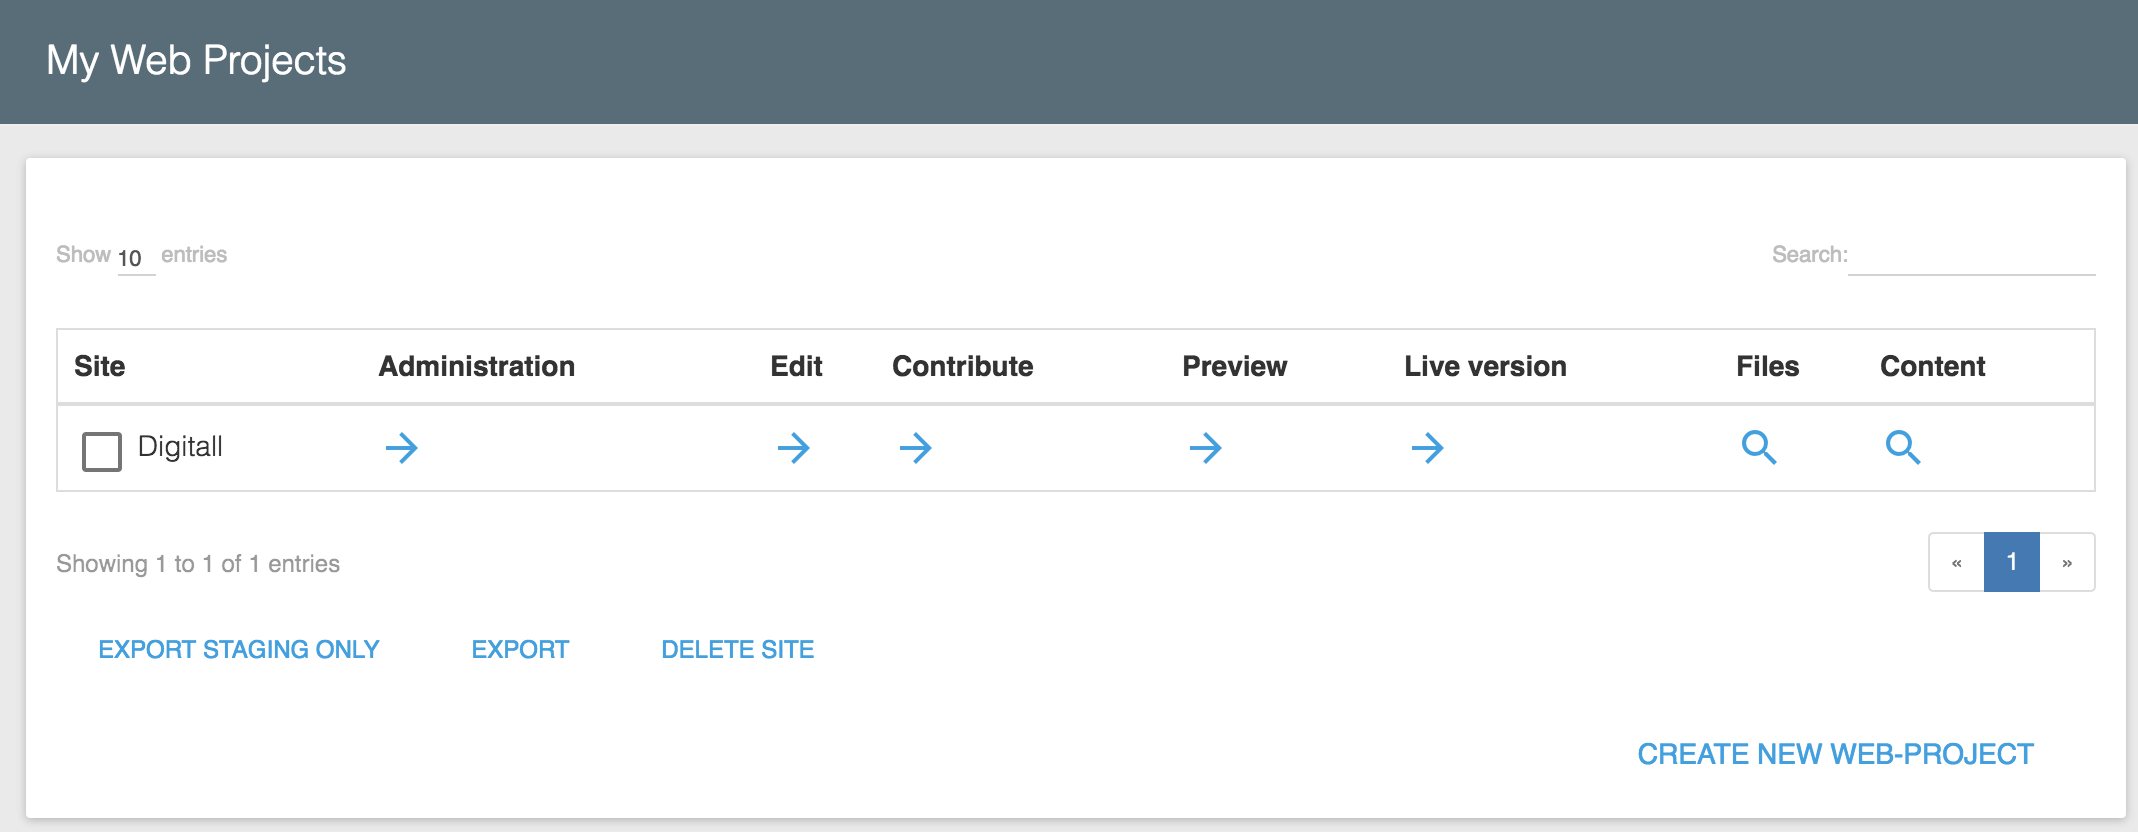
Depending on the user roles for each site and the status of each site (published or not) green arrows buttons offer links to the different modes available
Administration(access to the website administration "Site Settings")Edit Mode(complete editing interface)Contribute(access to the contribute mode of the site)Preview(view the site with the staging content as if published now)Live(online site)Files(access to the document manager)Content(access to the content manager)
This panel is completed by some additional buttons for root and users with the “server administrator” role: export selected sites and create site.
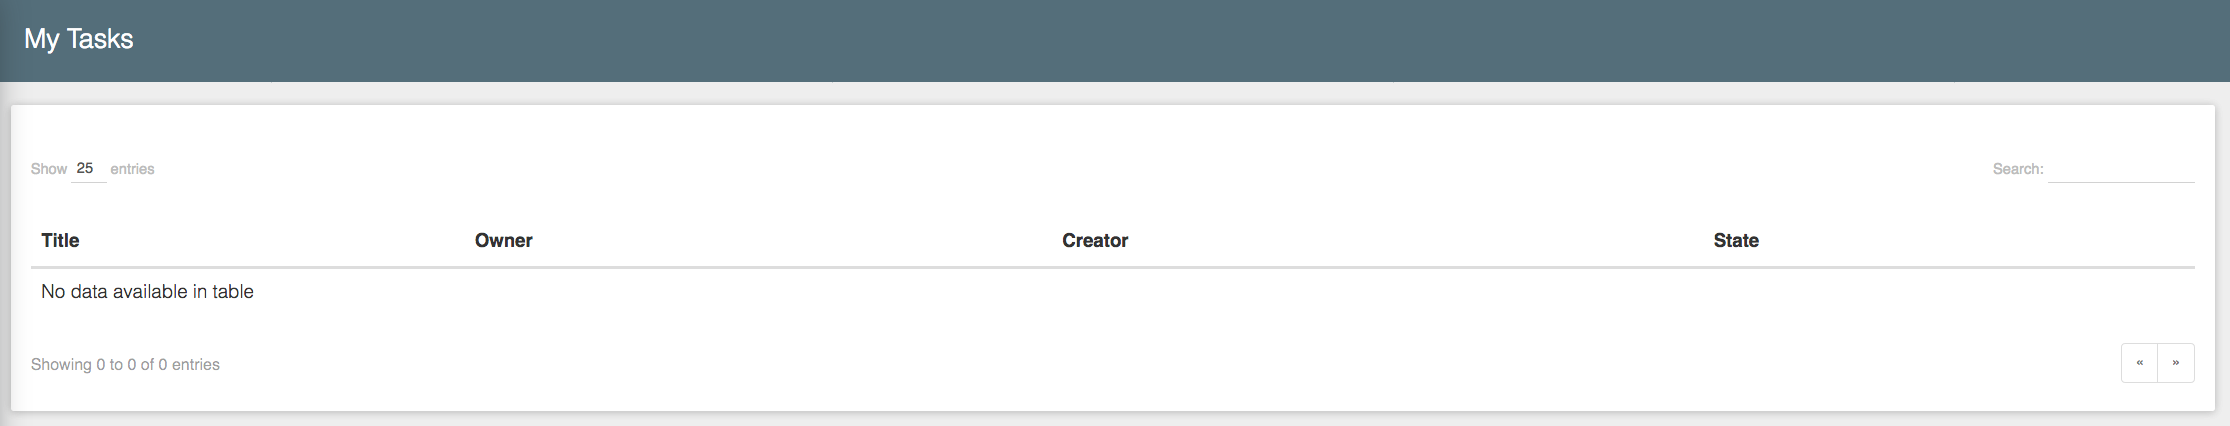
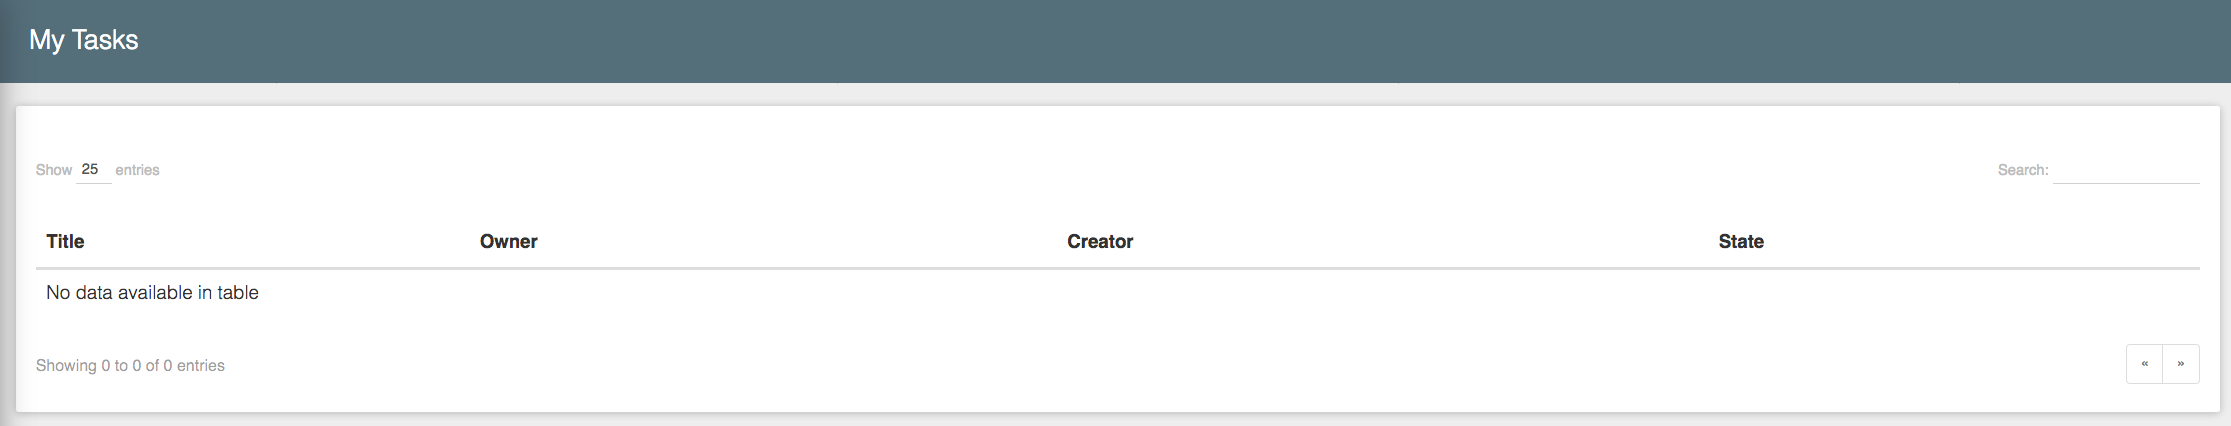
6 My Tasks
This panel displays the list of tasks assigned to the user or tasks that are not assigned to someone in particular but the user can decide to handle. For instance, a simple publication process usually creates a “review” task that is broadcasted to a group of users that can perform the review and not to one person in particular.
If no tasks are pending, the list is empty
If tasks can be handled, they appear in the list
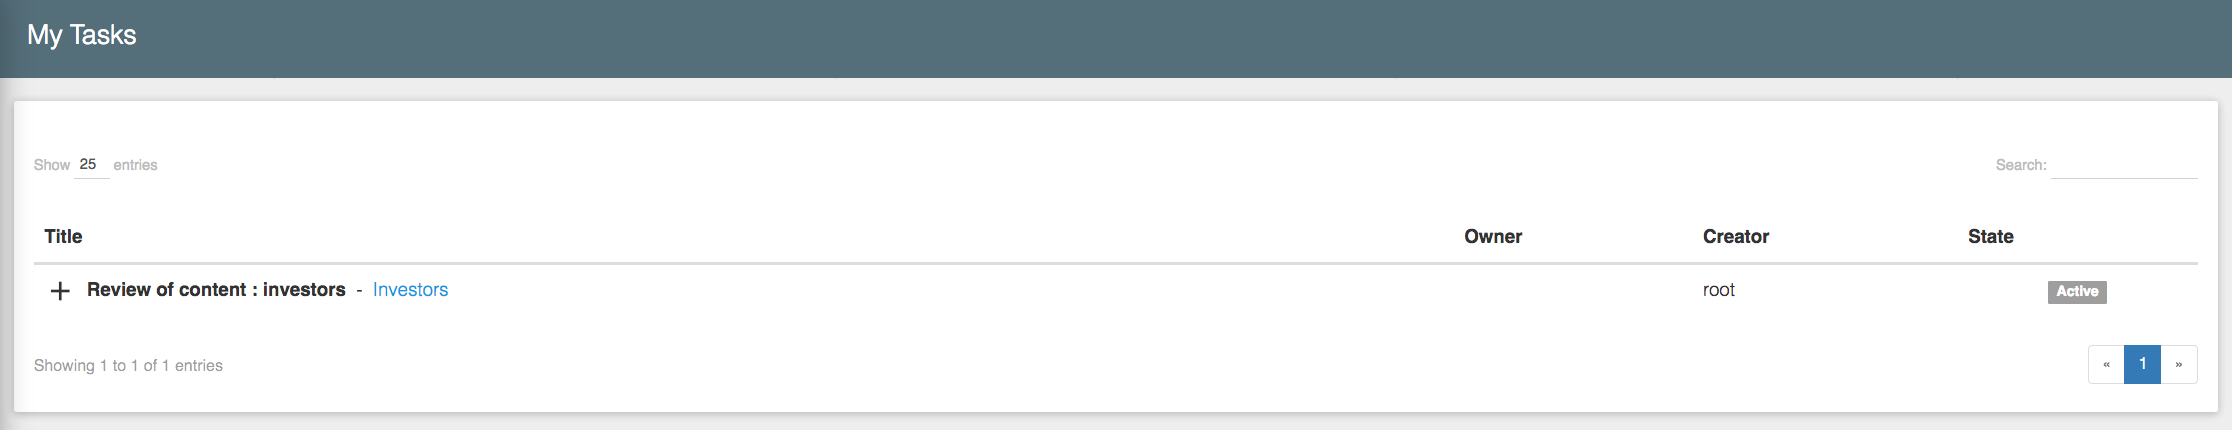
You can click on the blue + cross to see details about the task
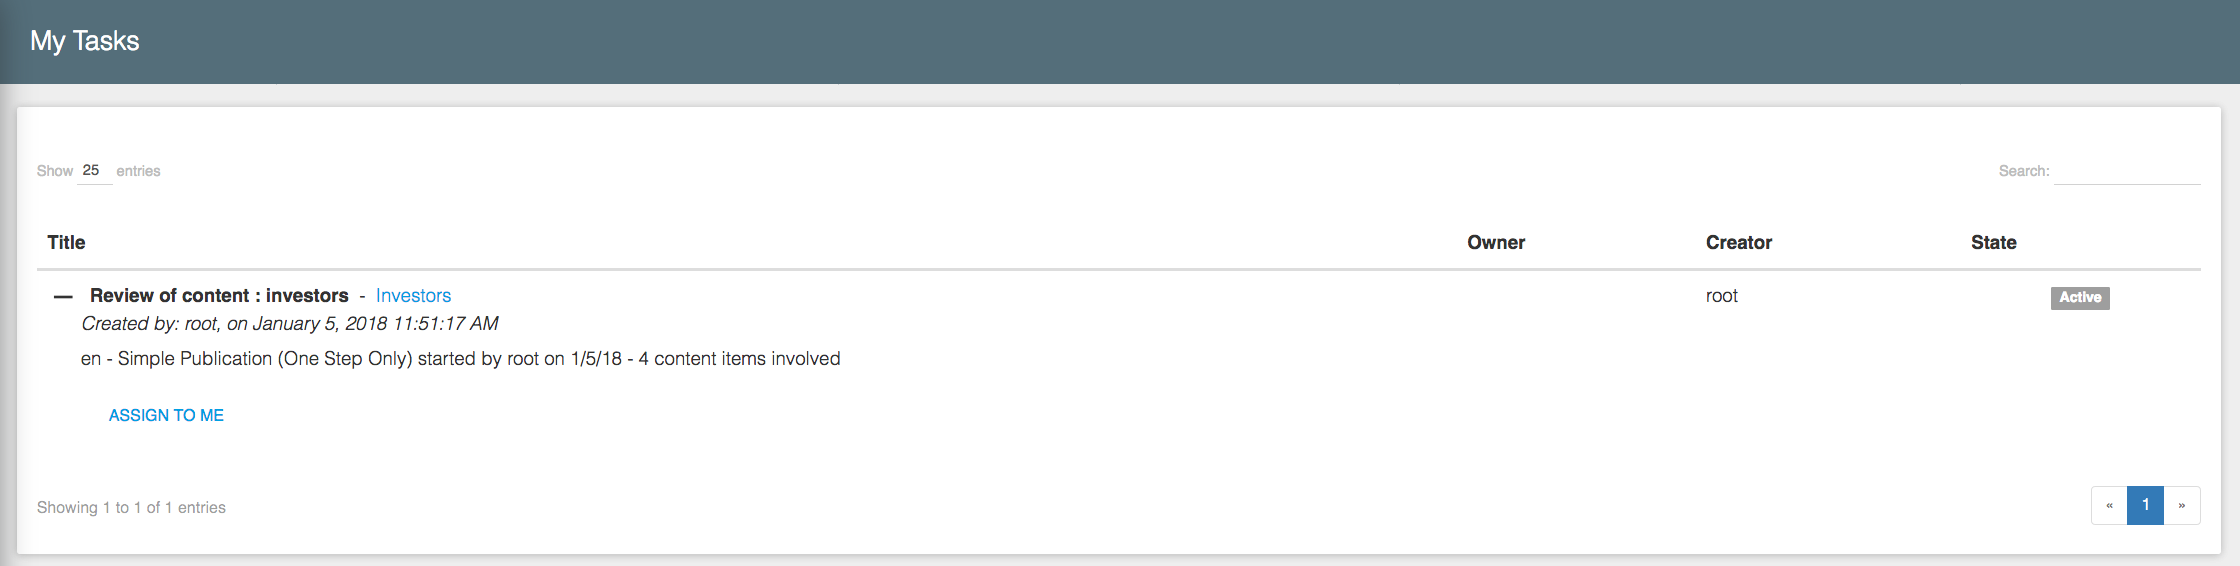
And decide to take the task by clicking on the “Assign to me button” (the tasks will disappear from others users dashboards)
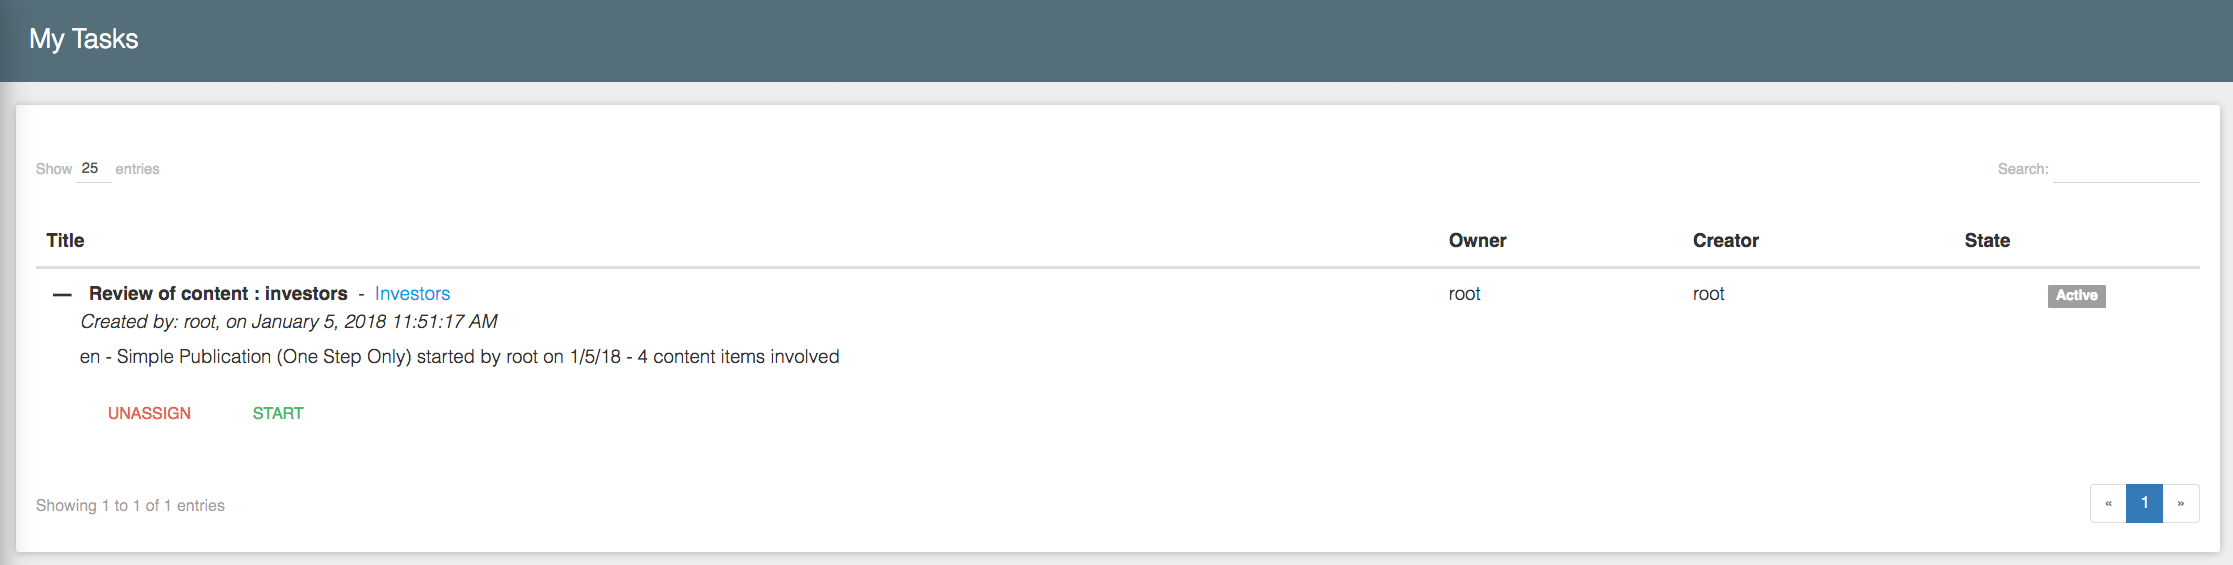
You can remove yourself from the assignees at any time by hitting the red button, or start working on the task by hitting the “start” green button.
If you start a task depending on which workflow step is involved and the options defined in the workflow process, the choices will be different, so it depends really on your platform settings. In the image below, the review tasks is simply associated with two possible choices “accept publication” (the page will then be published) or “reject” (the person who started the workflow will be notified that you have refused the publication)

Once a task has been processed, the list is updated and the task has been removed.