Fine tuning your Digital Experience Manager server
After having implemented all your templates and you are satisfied with your website, there may be some modifications to be done to enhance the performance of your server.
Before changing any values on your production server, you should ask yourself the following questions:
- How many editors do you have working simultaneously on the system?
- What is the number of authenticated users that can log into your system (in general, not necessarily at the same time)?
- What is the number of pages that you have in your system, and if they contain a lot of resources (PDF files, etc.)?
As a general rule, in order to test the performance of any system running Digital Experience Manager, here are the issues that need to be addressed:
- Tomcat and the amount of virtual memory (typically the -Xmx part in the setenv.sh/setenv.bat file)
- The database and its default settings
- Digital Experience Manager properties configuration
The values given here are the high values and have been tested, but that does not mean that this corresponds to the values you should set. The way to find the proper values that will fit your system is to increase progressively, and set the values here one at a time (except for the server.xml and database pool size, they go by pair). Then run a load test (bearing in mind the answers to the questions at the beginning of this section) to see if it corresponds to your expectations.
1 Tomcat
1.1 bin/setenv.sh or bin/setenv.bat
We usually recommend raising the amount of virtual memory (-Xms and -Xmx parameters) in your bin/setenv.sh (non-Windows OS) or bin/setenv.bat (on Windows) file to 2048, 4096 or even higher.
It is not necessarily true that the more virtual memory you give to your system, the faster you get, as sometimes having a lot of memory can benefit you in the beginning, but then garbage collection may take longer, which will make your server unavailable for a longer period of time.
1.2 conf/server.xml
Here you can increase the amount of maxThreads as well as the amount of acceptCount. These settings are the ones handling the connections to your server. maxThreads is the maximum number of threads processing requests in Tomcat, whether serving pages from Digital Experience Manager cache or not. If this one is exceeded, then errors will be sent to the client. In case you need to modify those settings, do it in the HTTP connector, the AJP connector or both, depending how you access your application server.
On the other hand, raising this number may not bring the wanted effect. For example, if you leave maxModulesToGenerateInParallel at 50 in jahia.properties, as no more than that number will do the real work, while the other threads will queue. But we will talk about that configuration in chapter “5.4 Module generation queue”.
2 Database
As we have increased the amount of threads in Tomcat, we have to tune the database connection pool on Digital Experience Manager side and also eventually the maximum number of connection your DBMS is allowing.
Note please that the maximum number of active DB connections in your pool should be in any case higher than maximum number of HTTP or AJP threads, your application server is processing at a time. And in turn your DBMS server should allow that maximum number of DB connections (also considering other applications, which access the same DBMS).
3 Cache configuration
Starting with Digital Experience Manager 7.0.0.5, we have separated the caches into two memory spaces. One will hold the big caches (HTML, dependencies and files), the other one will hold all the other caches (users, groups, ACLs, etc.).
This decision about the split was taken after intensive performance tests to achieve the best results and the easiest configuration. This campaign of performance tests will help us guide you through the configuration of your cache behavior.
First thing to know is by default your Digital Experience Manager configuration is a generic one, this means we try to find the best compromise for every configuration. As is by default your caches are configured using a percentage of your memory:
<ehcache xmlns:xsi="http://www.w3.org/2001/XMLSchema-instance"
         xsi:noNamespaceSchemaLocation="ehcache.xsd"
         updateCheck="false" monitoring="autodetect"
         name="org.jahia.ehcachemanager"
         dynamicConfig="true"
         maxBytesLocalHeap="400M">
and
<ehcache xmlns:xsi="http://www.w3.org/2001/XMLSchema-instance"
         xsi:noNamespaceSchemaLocation="ehcache.xsd"
         updateCheck="false" monitoring="autodetect"
         name="org.jahia.ehcachemanager.big"
         dynamicConfig="true"
         maxBytesLocalHeap="1600M">
Which on a default minimum production configuration of 4Gb give us 2Gb of cache (50% of heap). First, we will give you some guidelines on how to set up those limits depending on your JVM memory, and then we will see how to check the status of your caches so that you can best adapt those sizes.
3.1 How to configure/size your caches
The HTML cache is the cache that can grow very fast depending on how many pages and authenticated users you have and ACLs. So, this is the one that will be the one to increase mostly.
| Jvm Memory | General Cache | HTML Cache | % |
|---|---|---|---|
| 4Gb | 400M | 1600M | 50 |
| 6Gb | 500M | 2500M | 50 |
| 8Gb | 1G | 5G | 75 |
To update your configuration, you need to update two files in your Digital Experience Manager installation, they are by default located in tomcat/webapps/ROOT/WEB-INF/classes. Those files are ehcache-jahia.xml and ehcache-jahia-html.xml or ehcache-jahia-cluster.xml and ehcache-jahia-cluster-html.xml if you are in cluster. Look up for the <ehcache> tag near the top of the file and update the value of maxBytesLocalHeap, save and restart the Digital Experience Manager. This is only a general guideline to give you a head starts when you increase the amount of RAM available for Digital Experience Manager, you need to adapt the cache first following those generic guidelines then we will see how to refine them. However, the important part is that if you do increase your memory available to your Jahia, you need to increase the limit for those Ehcache managers otherwise the increase in performance might not be the one expected.
3.2 How to monitor and tune caches
To monitor your caches behavior, go to: http://localhost:8080/tools/cache.jsp
There you should see something like this:
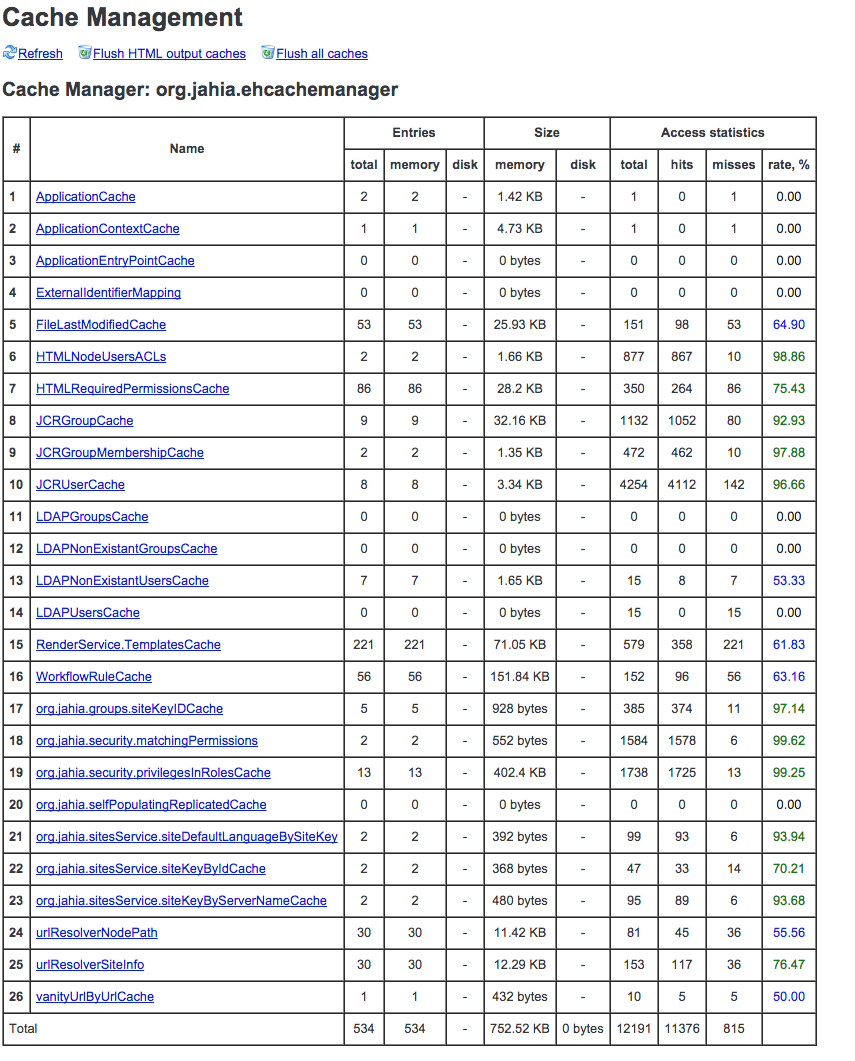
Once the page is displayed click on “show size in bytes” to display the sizes of all the caches.
At the bottom line of each table you will see the overall size of each manager. This is already a very good indicator if your caches are near their maximum size or not. If they are not, keep an eye on them on a regular basis for the first few weeks after launching your platform.
Monitoring those numbers will give you the best size needed, if you do have 8Gb of RAM but not that many pages but a lot of users and ACLs you might need more space for the users/groups cache manager than for the html one.
The main rule to follow here is that the HTML caches will deal with whatever space they have, if too little you will regenerate more fragments than needed which will have an impact on rendering but maybe not so much as most of the shared fragments will still be in memory. On the other side the general cache manager need to have plenty of space to keep all objects in memory, if you start to see a lot of misses on eternal caches in this manager you need to increase the memory limit (to see if a cache is configured as eternal click on “show config details” then on the “?” next to the cache name). As some of those caches have to be eternal Ehcache should never evict them.
3.3 List of eternal caches
ApplicationCacheApplicationContextCacheApplicationEntryPointCacheExternalIdentifierMappingFileLastModifiedCacheHTMLNodeUsersACLs(50M limit by default)HTMLRequiredPermissionsCacheJCRGroupCache(100M limit by default)JCRGroupMembershipCache(100M limit by default)RenderService.TemplatesCache(10M limit by default)WorkflowRuleCacheorg.jahia.security.matchingPermissions(1M by default)org.jahia.security.privilegesInRolesCacheorg.jahia.services.usermanager.JahiaGroupManagerService.groupPathByGroupNameCacheorg.jahia.services.usermanager.JahiaGroupManagerService.membershipCacheorg.jahia.services.usermanager.JahiaUserManagerService.userPathByUserNameCacheorg.jahia.sitesService.siteDefaultLanguageBySiteKeyorg.jahia.sitesService.siteKeyByServerNameCacheorg.jahia.sitesService.sitesListCachevanityUrlByUrlCache
3.4 Behavior of HTML Caches
The HTMLCache contains all the generated fragments of your pages/users. The HTMLDependenciesCache and HTMLREGEXPDependenciesCache contain a mapping of dependencies (nodes or regular expression) and the fragment keys linked to them, so that when you publish a node we know which fragments need to be regenerated.
Those caches have a strong interdependency, so when memory is needed and Ehcache will have to evict/expire some entries in one of the “HTML*DependenciesCache” a listener will remove the dependent entries in HTMLCache. So that everything in cache is always in sync.
4 Module generation queue
The queue can be configured in:
<digital-factory-config>/jahia/jahia.properties
Here you should increase the following value for your server:
######################################################################
### Concurrent processing options ####################################
######################################################################
# This variable controls how many threads are allowed to do heavy weight
# processing (module creation not served from the cache)
maxModulesToGenerateInParallel = 50
This value controls how many parallel threads will be allowed to start rendering modules not coming from cache, meaning that they will open JCR and DB connections to obtain the content from there. maxModulesToGenerateInParallel in jahia.properties should not be bigger than the maxThreads value in server.xml. The factor between maxModulesToGenerateInParallel and maxThreads (HTTP or/and AJP) should be around 2-3, meaning:
maxThreads = maxModulesToGenerateInParallel * (2-3)
For example:
maxModulesToGenerateInParallel = 100, maxThreads = 300
maxModulesToGenerateInParallel = 200, maxThreads = 600
5 Operating mode
Setting the operating mode to “production” enhances the performance of your server as when set to “development”, we check more often, which resources (templates, rules) on the server changed to redeploy or reinitialize them. The Development Mode will also write more debug information or not compress certain data to have it readable. The Distant Publication Server Mode provides similar performances as the Production Mode, but deactivates some authoring features, as you are not supposed to perform authoring actions directly on this server. This mode is configured in digital-factory-config/jahia/jahia.properties:
# This setting can be used to activate particular profile:
# - development
# - production
# - distantPublicationServer
operatingMode = development
6 Maintenance mode
You can enable the maintenance mode to disable rendering of any pages except for the tools section of your Digital Experience Manager instance. This allows system administrators to perform operations on the instance without running into possible interference from users’ actions. You can enable the maintenance mode from the System Maintenance page of the Tools section of your Digital Experience Manager instance: http://localhost:8080/tools/maintenance.jsp As noted on that page, the setting will not persist across server restarts. If you want to stay in maintenance mode after a server restart, you will need to set the maintenanceMode property to true in digital-factory-config/jahia/jahia.properties:
# Set this to true to enable maintenance mode, i.e. no requests will be
# served except to /tools/
#maintenanceMode = false
7 Read-only mode
It is possible to disable any editing operations on a specific Digital Experience Manager instance. This is particularly useful in a clustering scenario to create “pure” browsing nodes. You can enable the read-only mode from the System Maintenance page of the Tools section of your Digital Experience Manager instance: http://localhost:8080/jahia/tools/maintenance.jsp. As noted on that page, the setting will not persist across server restarts. If you want your Digital Experience Manager instance to stay in read-only mode even after a server restart, you will need to set the readOnlyMode property to true in digital-factory-config/jahia/jahia.properties:
# Set this to true to enable read-only mode, where access
# to edit/studio/administration modes is disabled
#readOnlyMode = false
8 JCR DataStore garbage collector
The goal of the JCR DataStore garbage collector is to clean the DataStore up by removing the no longer referenced binaries, i.e. entries which are no longer referenced from any workspace (live, default and versioning). As the nature of the DataStore is append-only (meaning it does not update or delete binaries automatically), this maintenance task should be run periodically (once a week, month or quarter). As the process could be resource intensive, the operation should be planned for times when the processing node is not under stress. The job can be triggered manually from the Jahia Tools Area -> JCR DataStore garbage collection (http://localhost:8080/ tools/jcrGc.jsp).
9 Storing binary files
During the installation process when setting the database connection settings an option allows you to either check or uncheck the box “Store binary data in the database”. According to the Apache Jackrabbit wiki (https://wiki.apache.org/jackrabbit/DataStore), “FileDataStore is guaranteed to be consistent after a crash (unlike the BundleFsPersistenceManager). It is usually faster than the DbDataStore, and the preferred choice unless you have strict operational reasons to put everything into a database.” We recommend you leave the “Store binary data in the database” checkbox unchecked. You cannot switch between the store implementation at a later time, unless one makes an export-import of the repository data. When using a FileDataStore in cluster, a shared file system needs to be used, where all cluster-nodes point to. By default the datastore is located at digital-factory-data/repository/datastore. You can override that location (and move the folder to any other place, when the Digital Experience Manager server is shut down), if needed, by changing the path value for jackrabbit.datastore.path in the jahia.properties file, for example:
# JCR file datastore path in case of the file-based binary storage
jackrabbit.datastore.path = /opt/DigitalExperienceManager-7/share/datastore
10 Increasing bundleCacheSize
Another recommendation is to increase the value of the bundleCacheSize settings. There are three PersistenceManagers using bundle caches: one for default workspace, one for live workspace and one for the version space. Each is on default just 8MB small. For large production systems you should increase the values, so that they together occupy around 1/10th of the JVM maximum heap space. More information can be found at this link. At that linked article you get some information how to read the bundleCache related log output in the console. Based on the miss to access ratio in your environment you can decide whether you should dedicate more or less memory to either default, live or the version bundle cache. In cluster, it also depends whether a cluster node is used for authoring/processing content or just for serving the published live content. So, you should adapt the setting to the cluster node role, and if for instance it is just used to serve live content, then the live bundle cache should get most of the 1/10th of heap. Usually the versioning bundleCache can be 2-4 times smaller than the default/live bundleCache, but it depends on the environment and usage, so you can decide on your own by checking the bundleCache lines in the console output. Let’s take as example that we have a system using 3GB of heap, we may set the bundleCacheSize to the following values: default: 128MB, live: 128MB, version: 64MB. Depending on the DX version, please, follow the steps in the next sections.
10.1 DX 7.1.2.0+
To increase the bundleCacheSize parameter of the different PersistenceManagers you can provide the following settings in the <digital-factory-config>/jahia/jahia.properties file:
jahia.jackrabbit.bundleCacheSize.workspace=128
jahia.jackrabbit.bundleCacheSize.versioning=64
The first entry sets the bundle cache size of the persistence manager for live and default workspaces to 128 MB. The second one – the size of the cache for versioning persistence manager. If you would like to set different cache size for default and live workspace, please, follow the instructions in the next section.
10.2 Older DX versions (<7.1.2.0)
To increase the bundleCacheSize parameter of the different PersistenceManagers you have to do this in the following files: For the version bundleCache open WEB-INF/etc/repository/jackrabbit/repository.xml and in the section Versioning/PersistenceManager adjust the value for the the bundleCacheSize parameter:
<param name="bundleCacheSize" value="64">
For the default bundleCache open digital-factory-data/repository/workspaces/default/workspace.xml and in the Workspace/PersistenceManager edit the following parameter value:
<param name="bundleCacheSize" value="128" />
For the live bundleCache open digital-factory-data/repository/workspaces/live/workspace.xml and in the Workspace/PersistenceManager edit the value for the bundleCacheSize parameter:
<param name="bundleCacheSize" value="128" />
A Digital Experience Manager server restart is needed for changes to be effective.
11 JCR indexing configuration
If you would like to override the indexing configuration of the JCR repository, you could place the files, named indexing_configuration.xml and indexing_configuration_version.xml into the digital-factory-config/jahia folder. Digital Experience Manager will detect them on startup and use them (instead of the digital-factory-data/repository/indexing_configuration.xml and digital-factory-data/repository/indexing_configuration_version.xml files).
12 Logging
12.1 Modifying the Logging Level
The following instructions apply to modify logging levels permanently. If you want to only change the level for a short time, you can use the runtime tool, described in chapter “6.4.2 Logging”. When you install a release of Digital Experience Manager, the logging level is set to the minimum to avoid slowing down the platform. If you need to increase it for debugging purpose, you need to modify the file log4j.xml which is in the following directory:
<digital-experience-manager-web-app-dir>/WEB-INF/etc/config
Log4j defines the logging levels as follows (from the more to the less verbose): ALL < DEBUG < INFO < WARN < ERROR < FATAL < OFF At the bottom of the file, you have the <root>... </root> part. Change the:
<level value="info"/>
To
<level value="debug"/>
for example, to have more debugging information in the console. You can also change this parameter for some specific part of Digital Experience Manager like Jackrabbit or Lucene. You can even add your own logger on a specific set of classes, for example:
<logger name="org.quartz">
    <level value="info"/>
</logger>
By default, logs are redirected to the standard out, which is normally the console. Under Windows, logs will be displayed in the DOS window where Tomcat is running. On Linux, logs will be redirected to the catalina.out file. As Digital Experience Manager uses Apache Log4j for its logging system, you can use tools like Chainsaw (part of the Log4j project) to better work with logging messages. You can change the log-level of Digital Experience Manager “on-the-fly” without having to shutdown and restart it. This is very useful when you need to have extra logs on a production server, but do not want to restart it just for this. Digital Experience Manager watches for changes in the log4j.xml file every 60 seconds, so once you have changed the log level, you will need to wait a few seconds before the changes will be effective. Do not forget to change the values of INFO back, as the DEBUG log level has a pretty important impact on performance.
12.2 Logging configuration location
If you would like to override the WEB-INF/etc/config/log4j.xml file completely or change its location, you have several options:
- By placing a file, named
log4j.xmlinto the<digital-factory-config>/jahiafolder. Digital Experience Manager will detect it on startup and use it (instead of theWEB-INF/etc/config/log4j.xmlfile) - By providing a Java system property named
jahia.log4j.configyou could specify the resource location for the Log4j configuration (using Spring resource's format), e.g. in thetomcat/bin/setenv.sh:
CATALINA_OPTS="$CATALINA_OPTS -Djahia.log4j.config=file:///opt/DigitalExperienceManager-7/log4j.xml"
12.3 Rolling over the log file (daily) on Windows
When running DX instance of a Windows-based machine, there is a know issue with the DailyRollingFileAppender (Bug 29726) that prevents the jahia.log from rolling over properly. The solution is to switch to the RollingFileAppender from the Apache Extras for Apache log4j project with an appropriate rollingPolicy configuration. Note, please, due to a special classloading on JBoss EAP this solution does not apply to a DX instance, running on JBoss EAP server.
If you are running the DX 7.2.1.1+ the apache-log4j-extras-1.2.17.jar is already included into the DX Web application. If you are running a version prior to 7.2.1.1, please, download the apache-log4j-extras-1.2.17.jar (checksums) and copy it into <dx-webapp-dir>/WEB-INF/lib folder manually.
Modify the file <dx-webapp-dir>\WEB-INF\etc\config\log4j.xml and replace the DailyRollingFileAppender with the RollingFileAppender with an rollingPolicy element as follows:
    <appender name="ROLL" class="org.apache.log4j.rolling.RollingFileAppender">
        <rollingPolicy class="org.apache.log4j.rolling.TimeBasedRollingPolicy">
            <param name="FileNamePattern" value="${jahia.log.dir}jahia.%d{yyyy-MM-dd}.log" />
        </rollingPolicy>
        <param name="File" value="${jahia.log.dir}jahia.log" />
        <param name="Threshold" value="debug" />
        ...

    <appender name="profilerLogs" class="org.apache.log4j.rolling.RollingFileAppender">
        <rollingPolicy class="org.apache.log4j.rolling.TimeBasedRollingPolicy">
            <param name="FileNamePattern" value="${jahia.log.dir}jahia_profiler.%d{yyyy-MM-dd}.log" />
        </rollingPolicy>
        <param name="File" value="${jahia.log.dir}jahia_profiler.log" />
        <param name="Threshold" value="debug" />
        ...
    <appender name="hitAccess" class="org.apache.log4j.rolling.RollingFileAppender">
        <rollingPolicy class="org.apache.log4j.rolling.TimeBasedRollingPolicy">
            <param name="FileNamePattern" value="${jahia.log.dir}jahia_access.%d{yyyy-MM-dd}.log" />
        </rollingPolicy>
        <param name="File" value="${jahia.log.dir}jahia_access.log" />
        <param name="Threshold" value="debug" />
        ...
Note, please, there are three different appenders, logging into different files. For all of them rollover, you need to apply the changes
If you are running a DX version, prior to 7.2.1.1, please, modify the digital-factory-data\karaf\etc\config.properties file and change the value of the karaf.bootstrap.log entry to be:
karaf.bootstrap.log=${jahia.log.dir}karaf.log
so that it uses another file name and not jahia.log (otherwise it prevents the jahia.log from rolling over on Windows).
A DX instance restart is needed for changes to be effective.